Example Reports and How to Make Them
Below is a list of reports we made in Metabase and how to build them for yourself in your site. Please note, there may be cases based on your system set up and use that the reports may not get you exactly the intended results you want. These reports are meant to be useful as is or may need some tweaks. Please reach out to the support team if you have any questions/concerns.
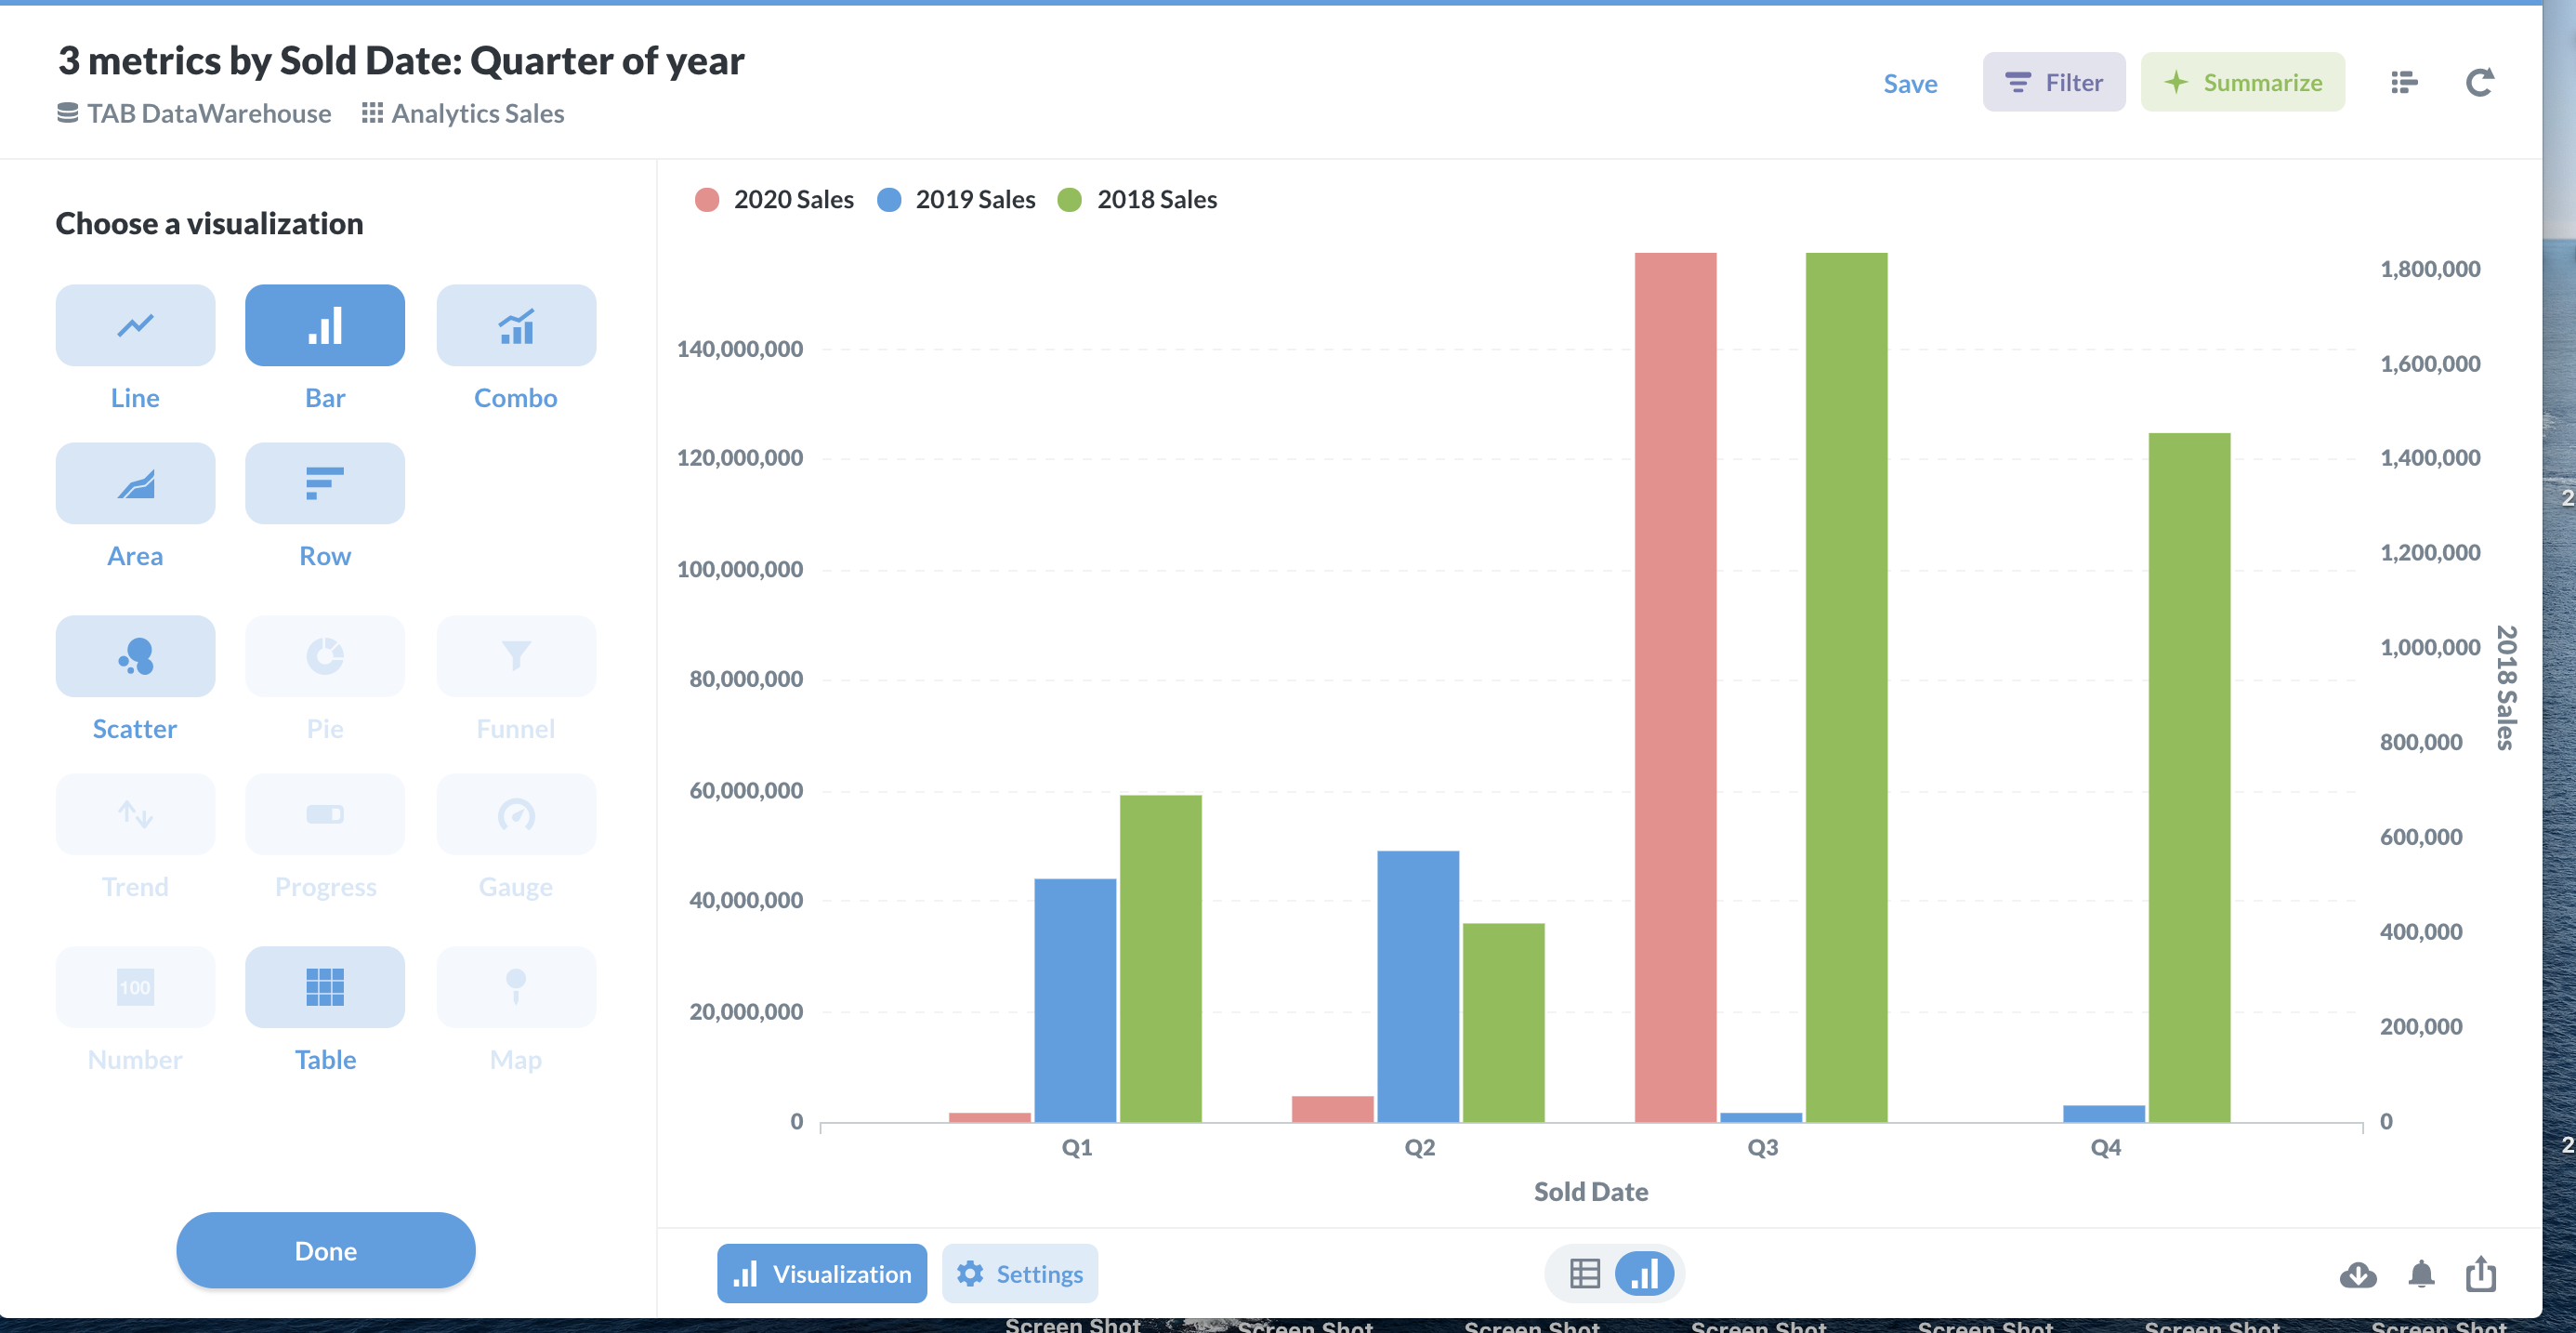
One of the most helpful reports to see how you are doing is a YOY (year over year) report. Any report that can show you how sales were from previous periods of time can help you see trends to investigate in more detail. The good news is Metabase makes it pretty simple to create your own time-based reports without the need for writing your own queries.
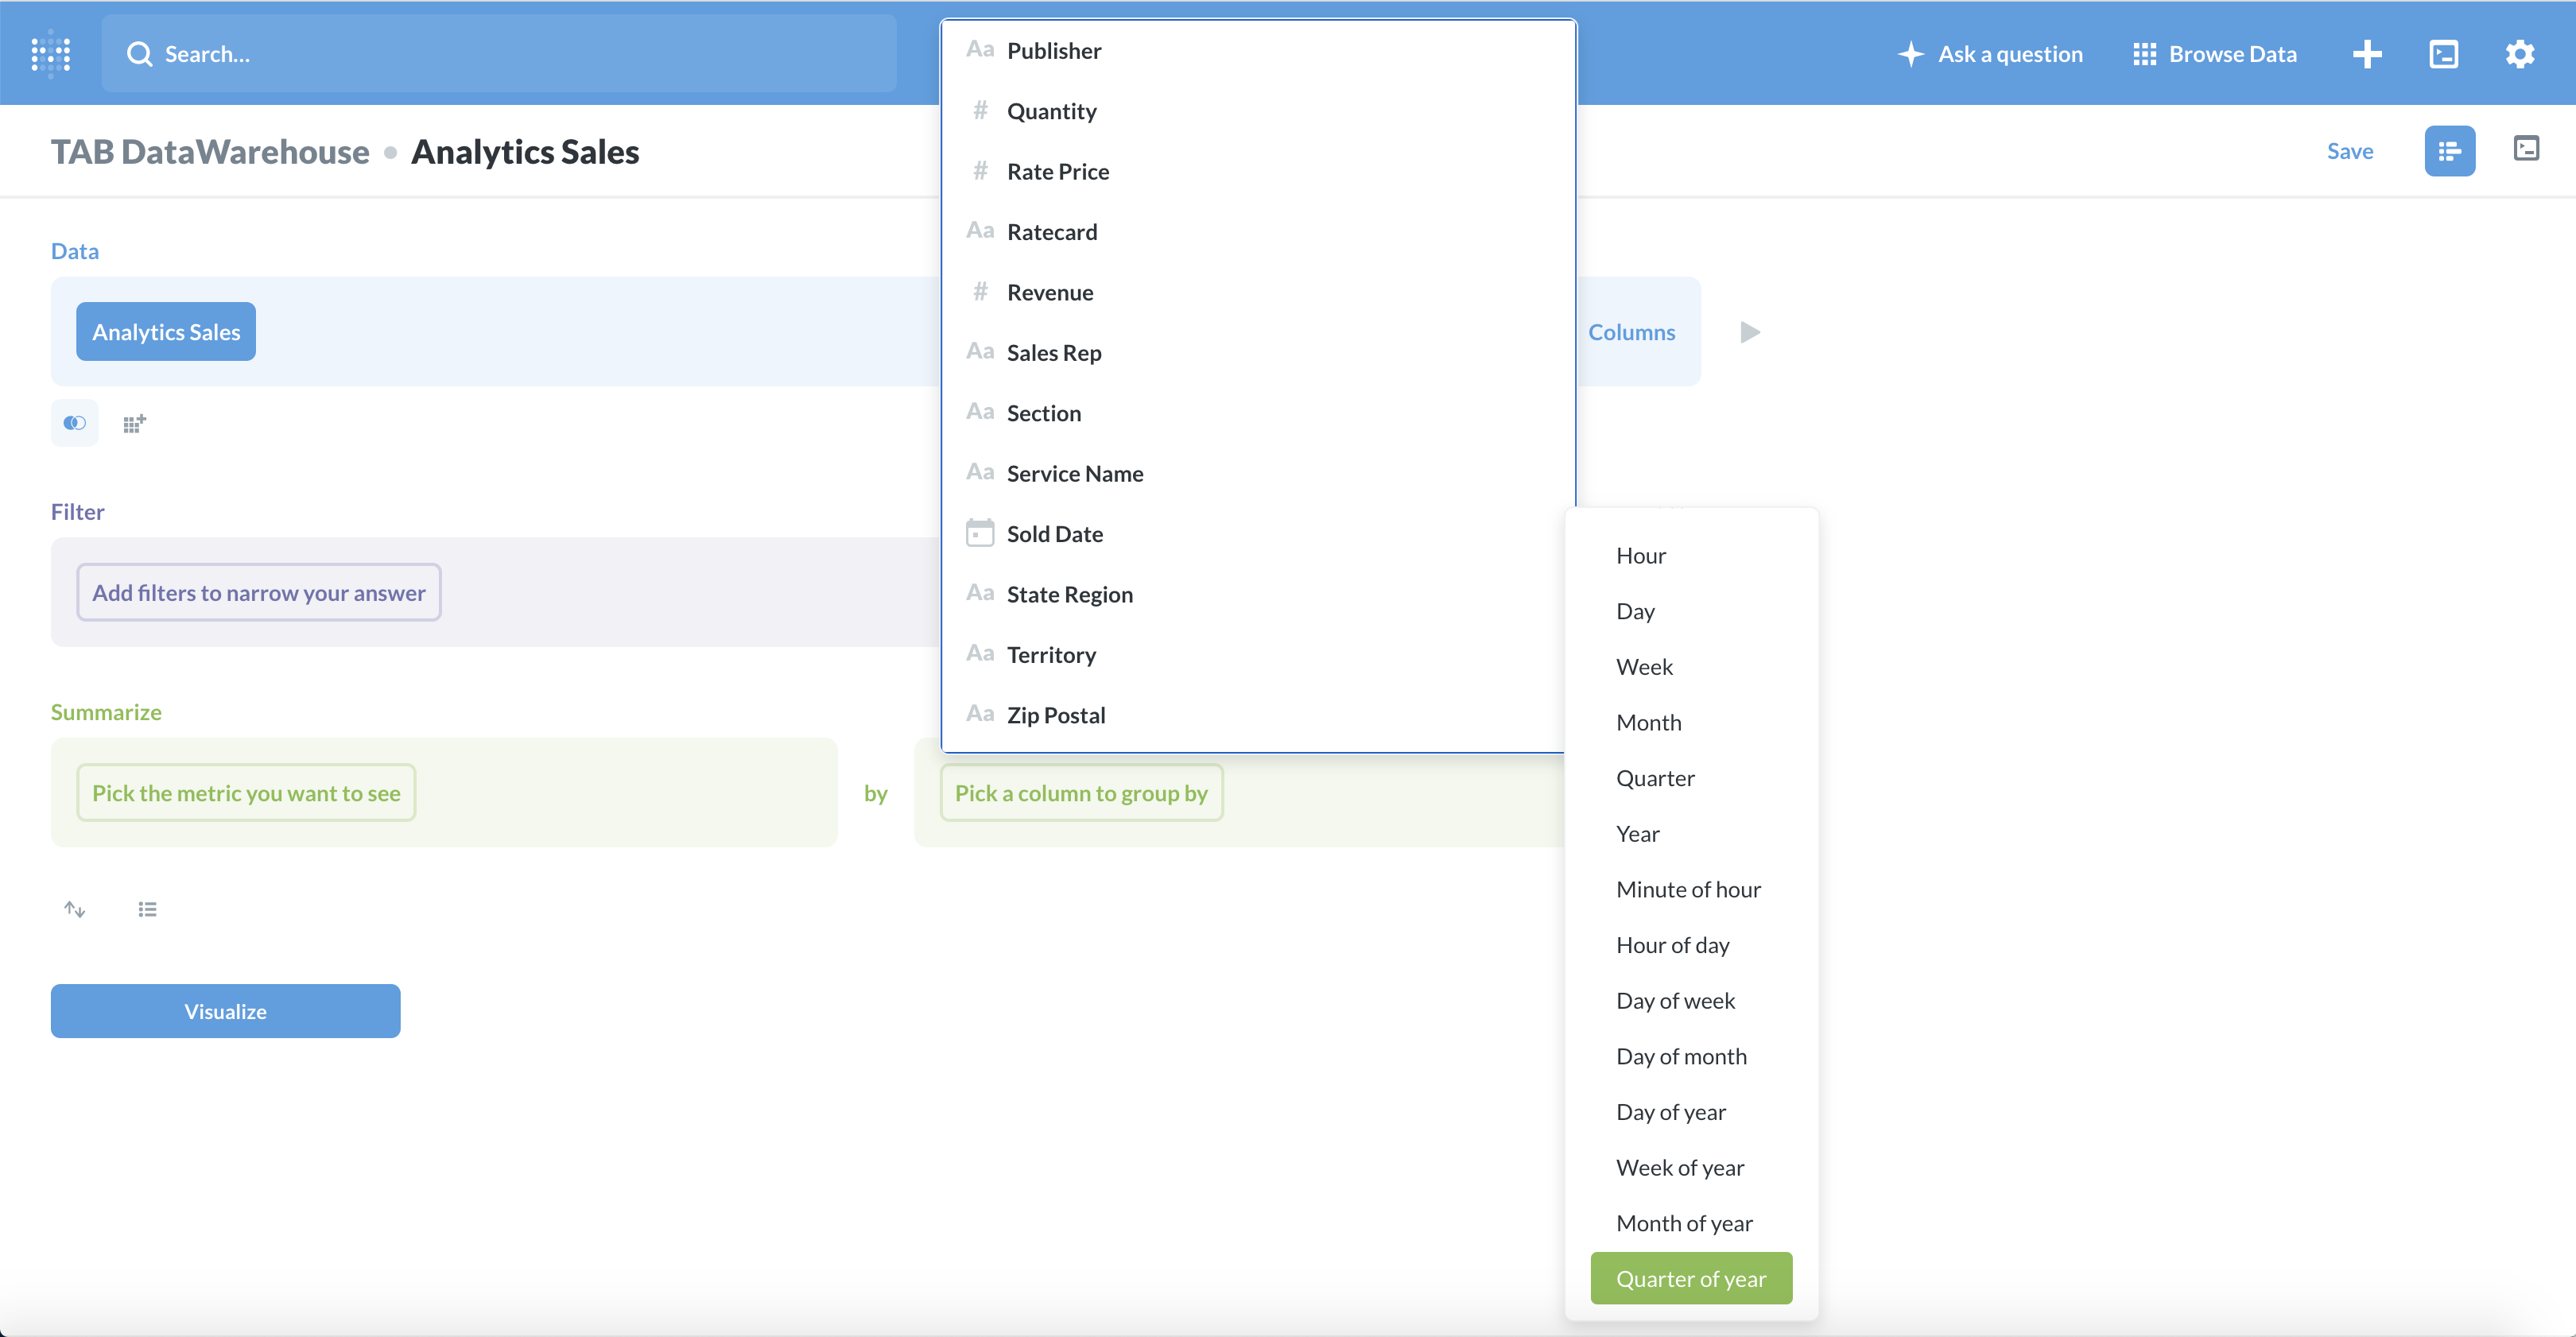
In order to use this feature in Metabase, you need to create a custom expression, which we will review. Before we do that, I am going to start by picking my table. For this example, I will start with the analytics sales table. My goal is to compare sales based on sold date by quarter over the past three years.
I will start by selecting my table, summarizes the date, and picking a group by of Quarter by Year.
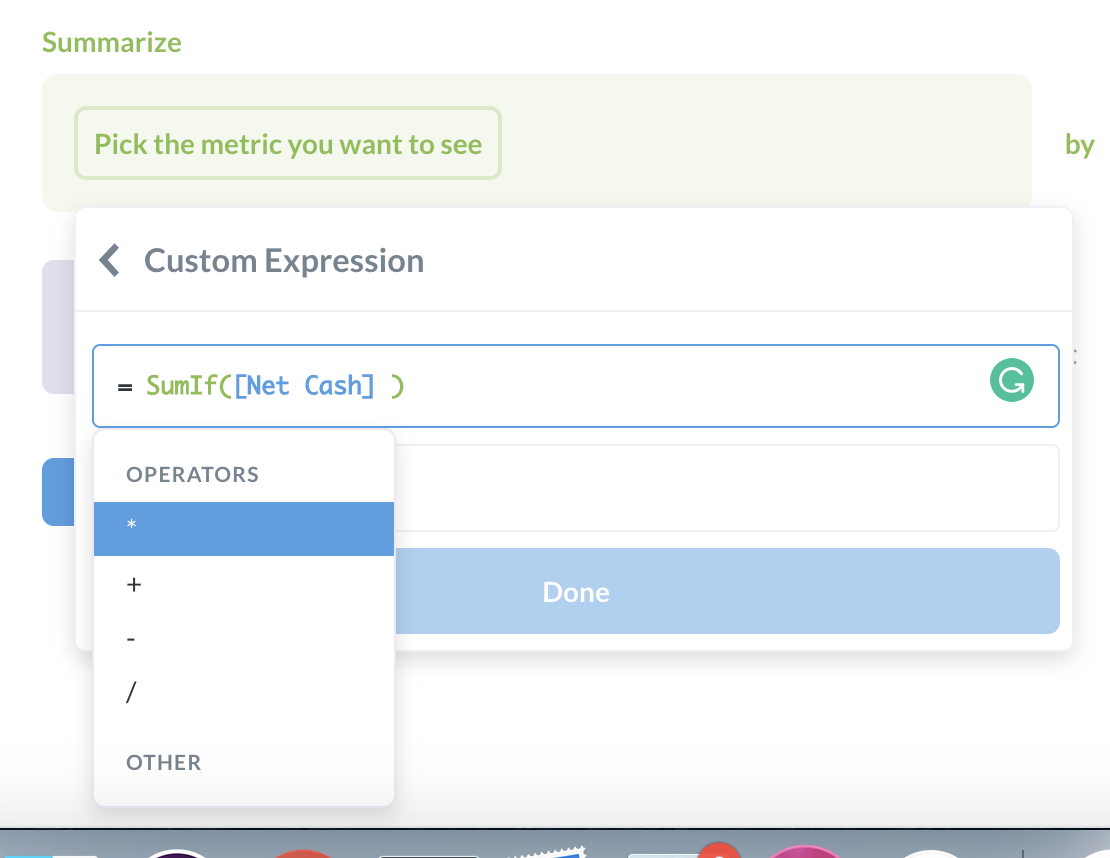
Now that I have that setup, I need to create my custom expresission. I am going to first select the 'Sumif' option. Now I need to choose what data I want to compare. For this example, I will enter in the Net Sales.
Because I want to review the few years, I am going to enter Between and then the start of the year to the end of the year in the following format.
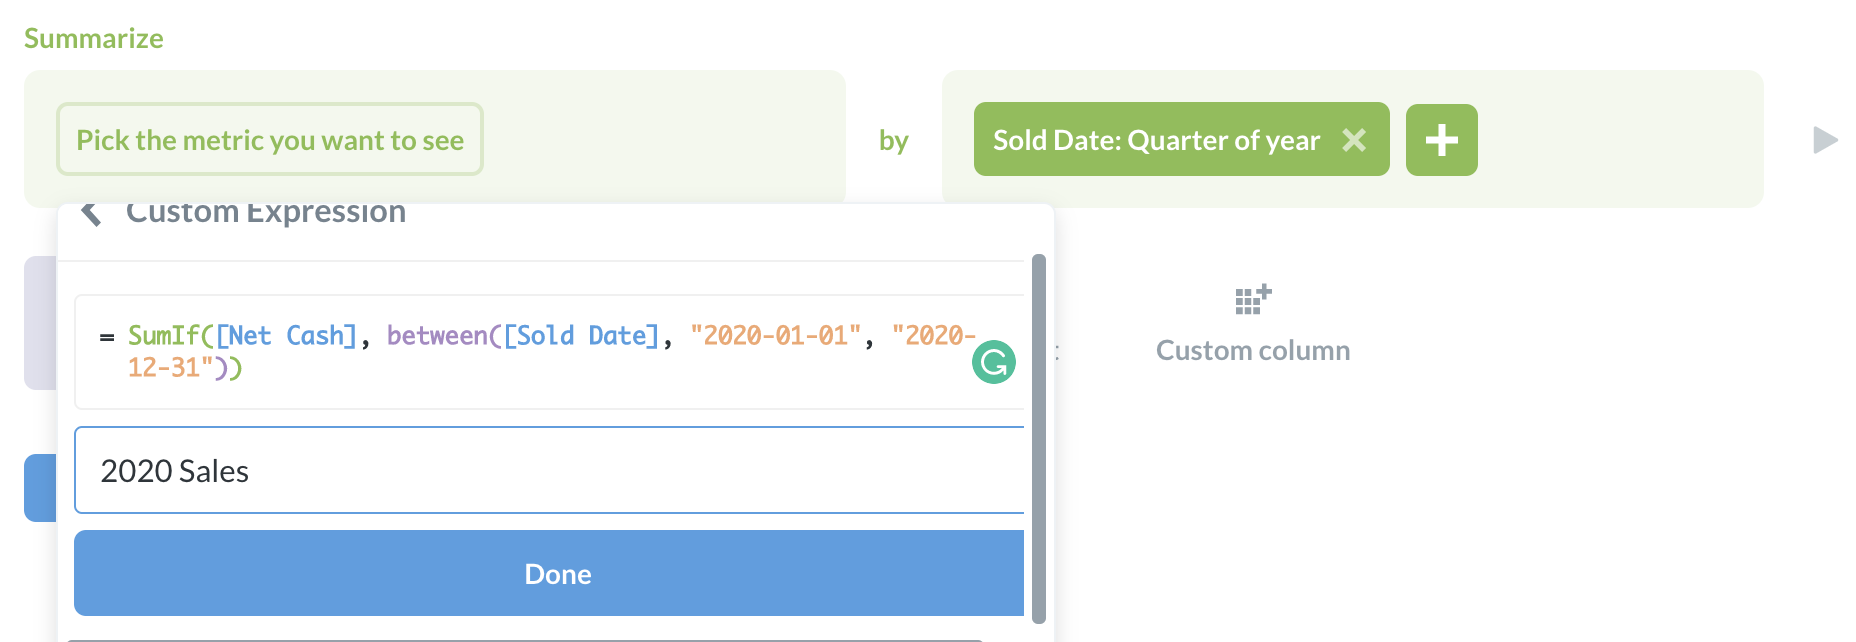
Not that I have one year, I will copy and paste the same expression into a new column and just change the year.
At this point, I have 2020, 2019, and 2018 setup. When I click Run, I will see each year has its own item in the report and I can show it as a graph.
I can expand on this by adding a filter for something like Sales rep to see how my reps are trending on their sales performance over the year.
If you are part of the production team, then you know the importance of keeping up with your tickets and being organized when it comes to MagBuilder. So, I created a dashboard to fit my production needs and help keep me organized. In this example, I created two tables that are fairly detailed and a few others with summary data that I can glance at and understand quickly.
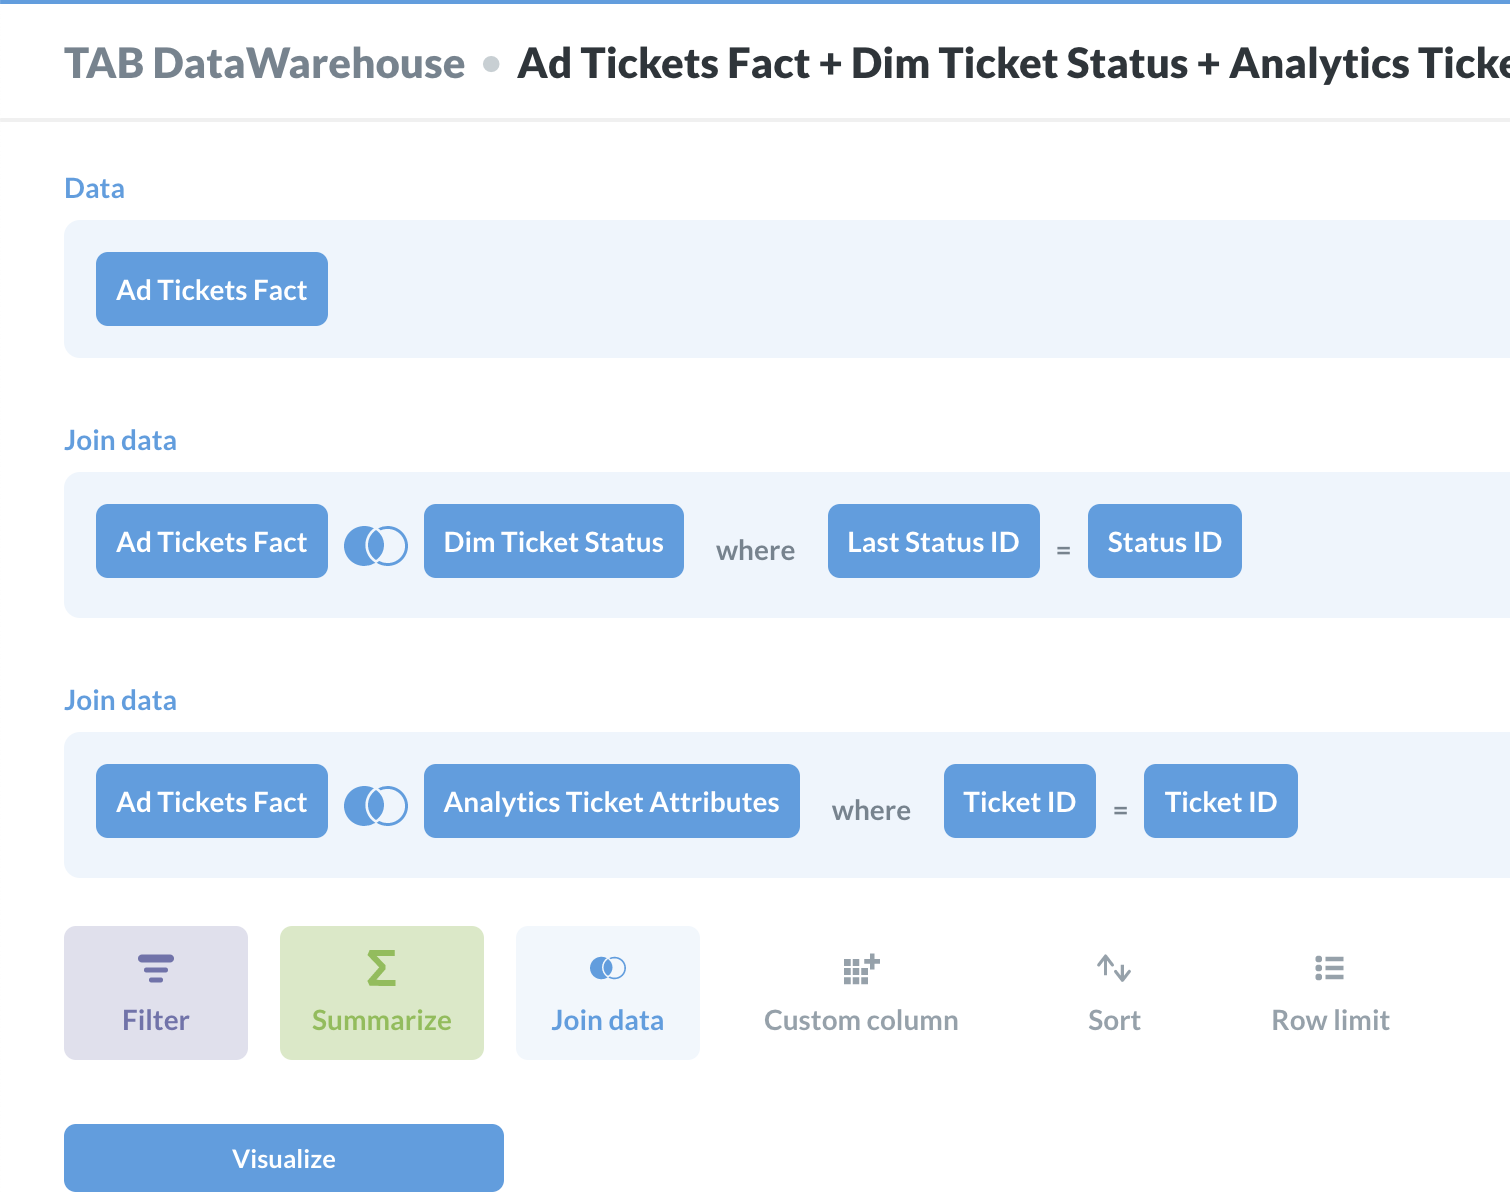
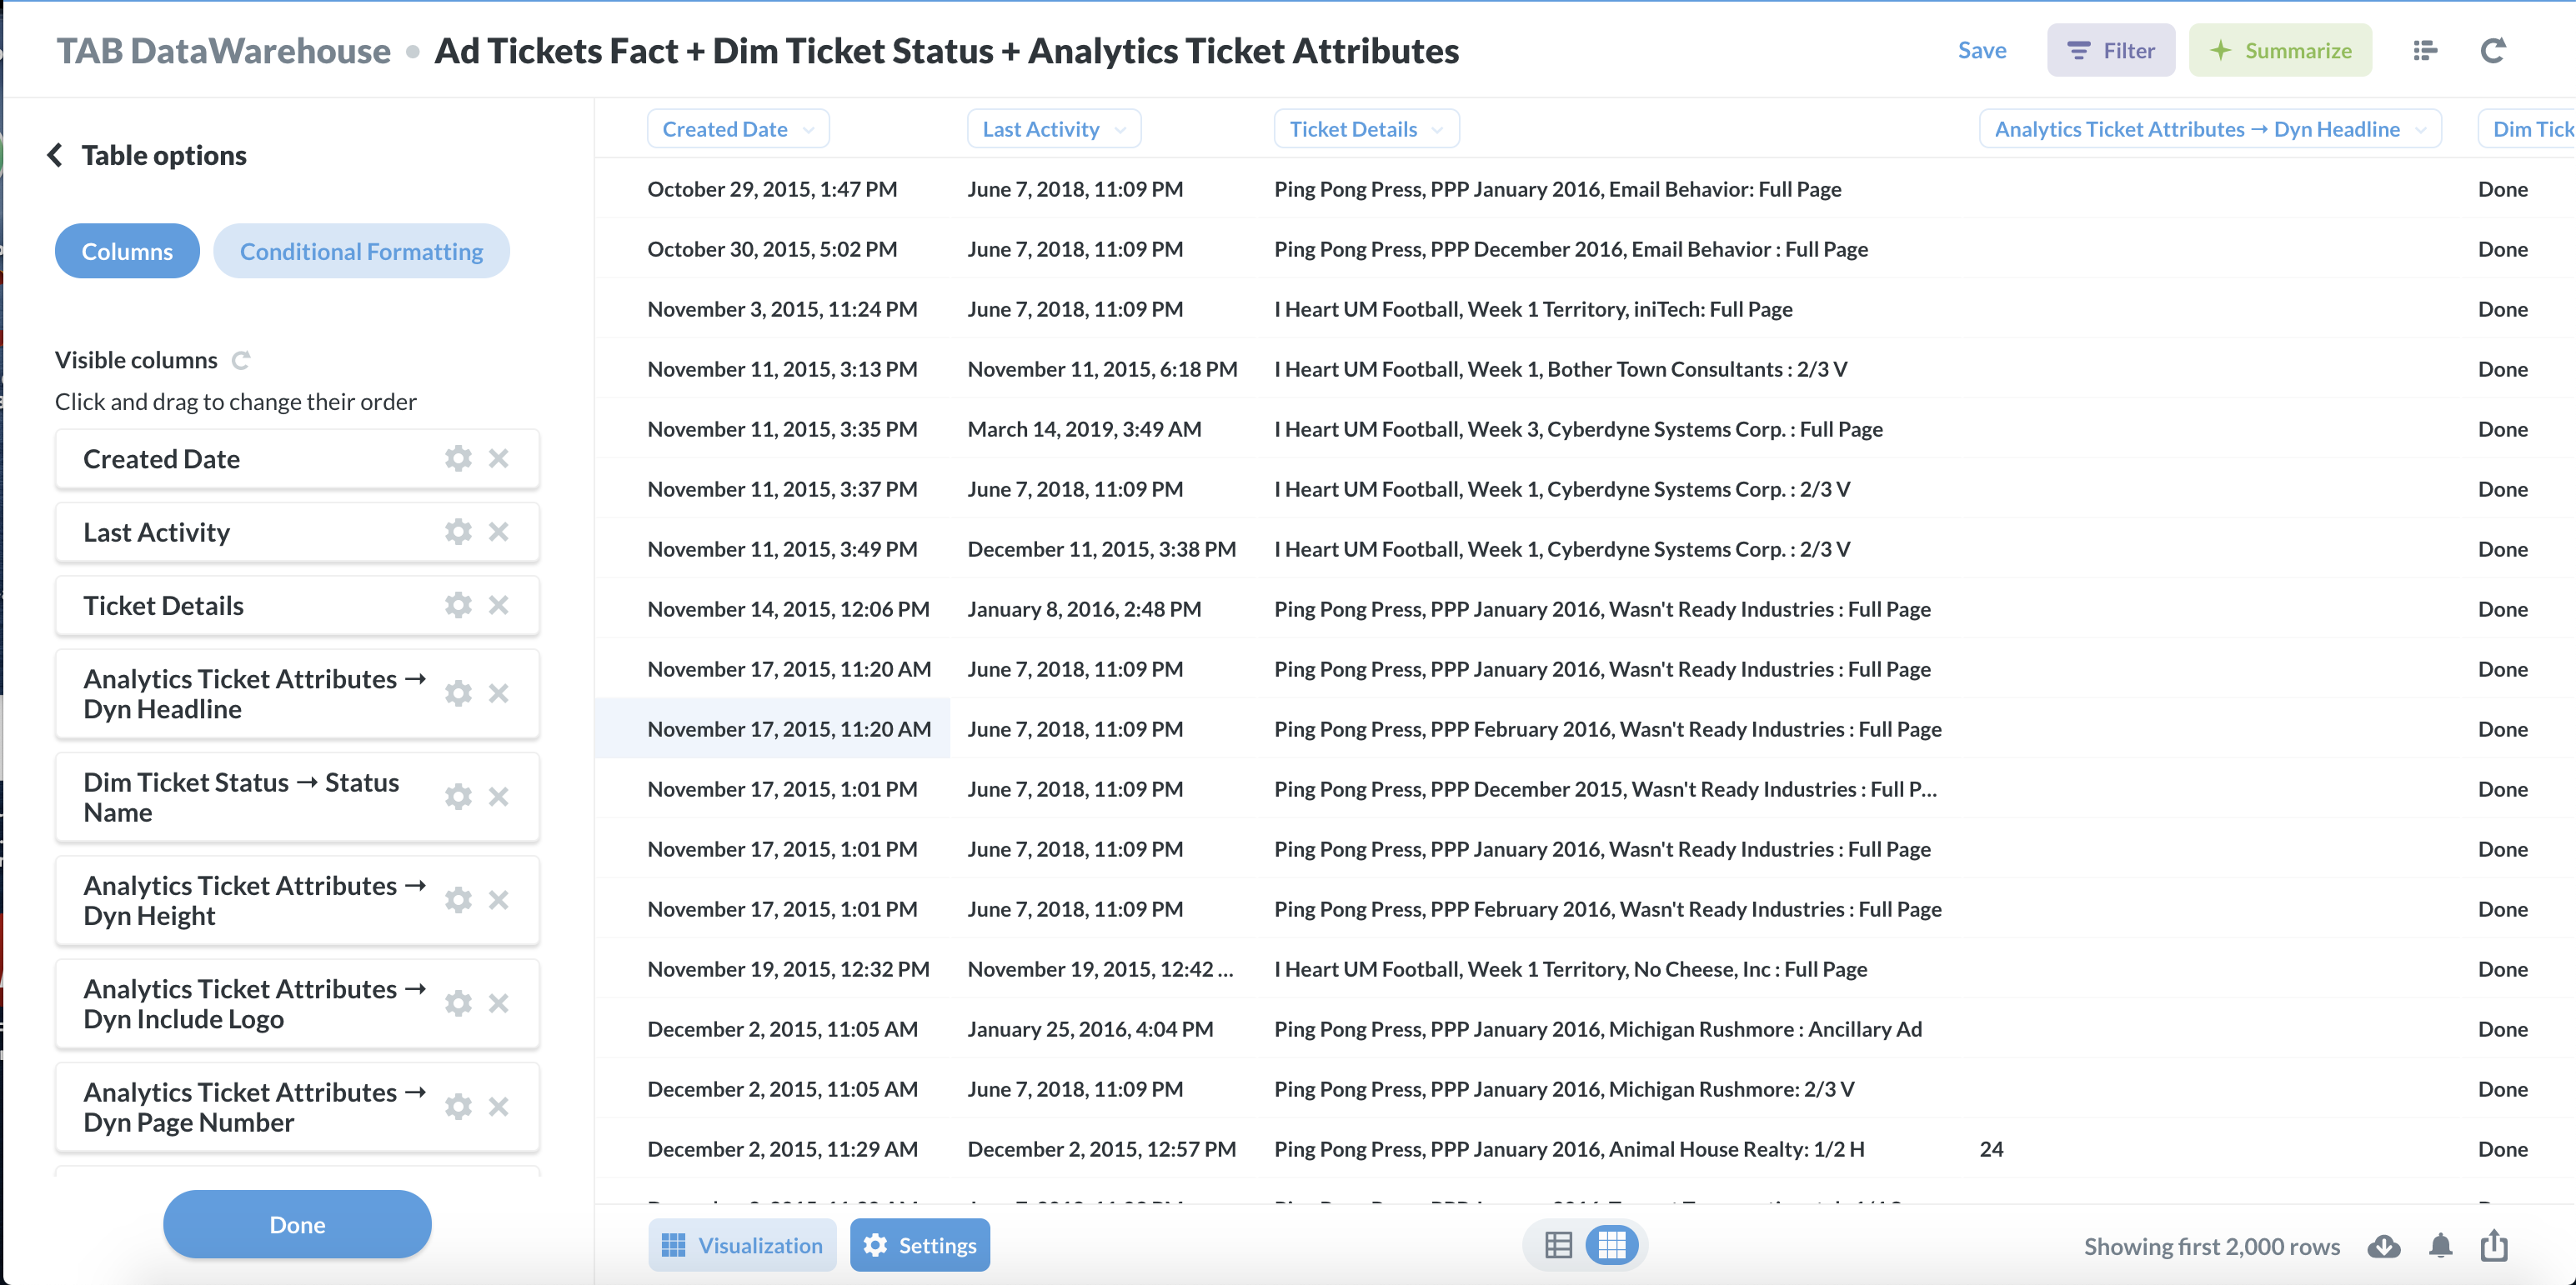
For my first table, I started with Ad Tickets Fact and joined it with both the Dim Ticket Status table and the Analytics Ticket Attributes table. Then, I clicked on visualization and got rid of all of the columns I did not need to see the data for. This gave me a table where I could see dynamic attributes, statuses, ticket details, and updates for each ad ticket.
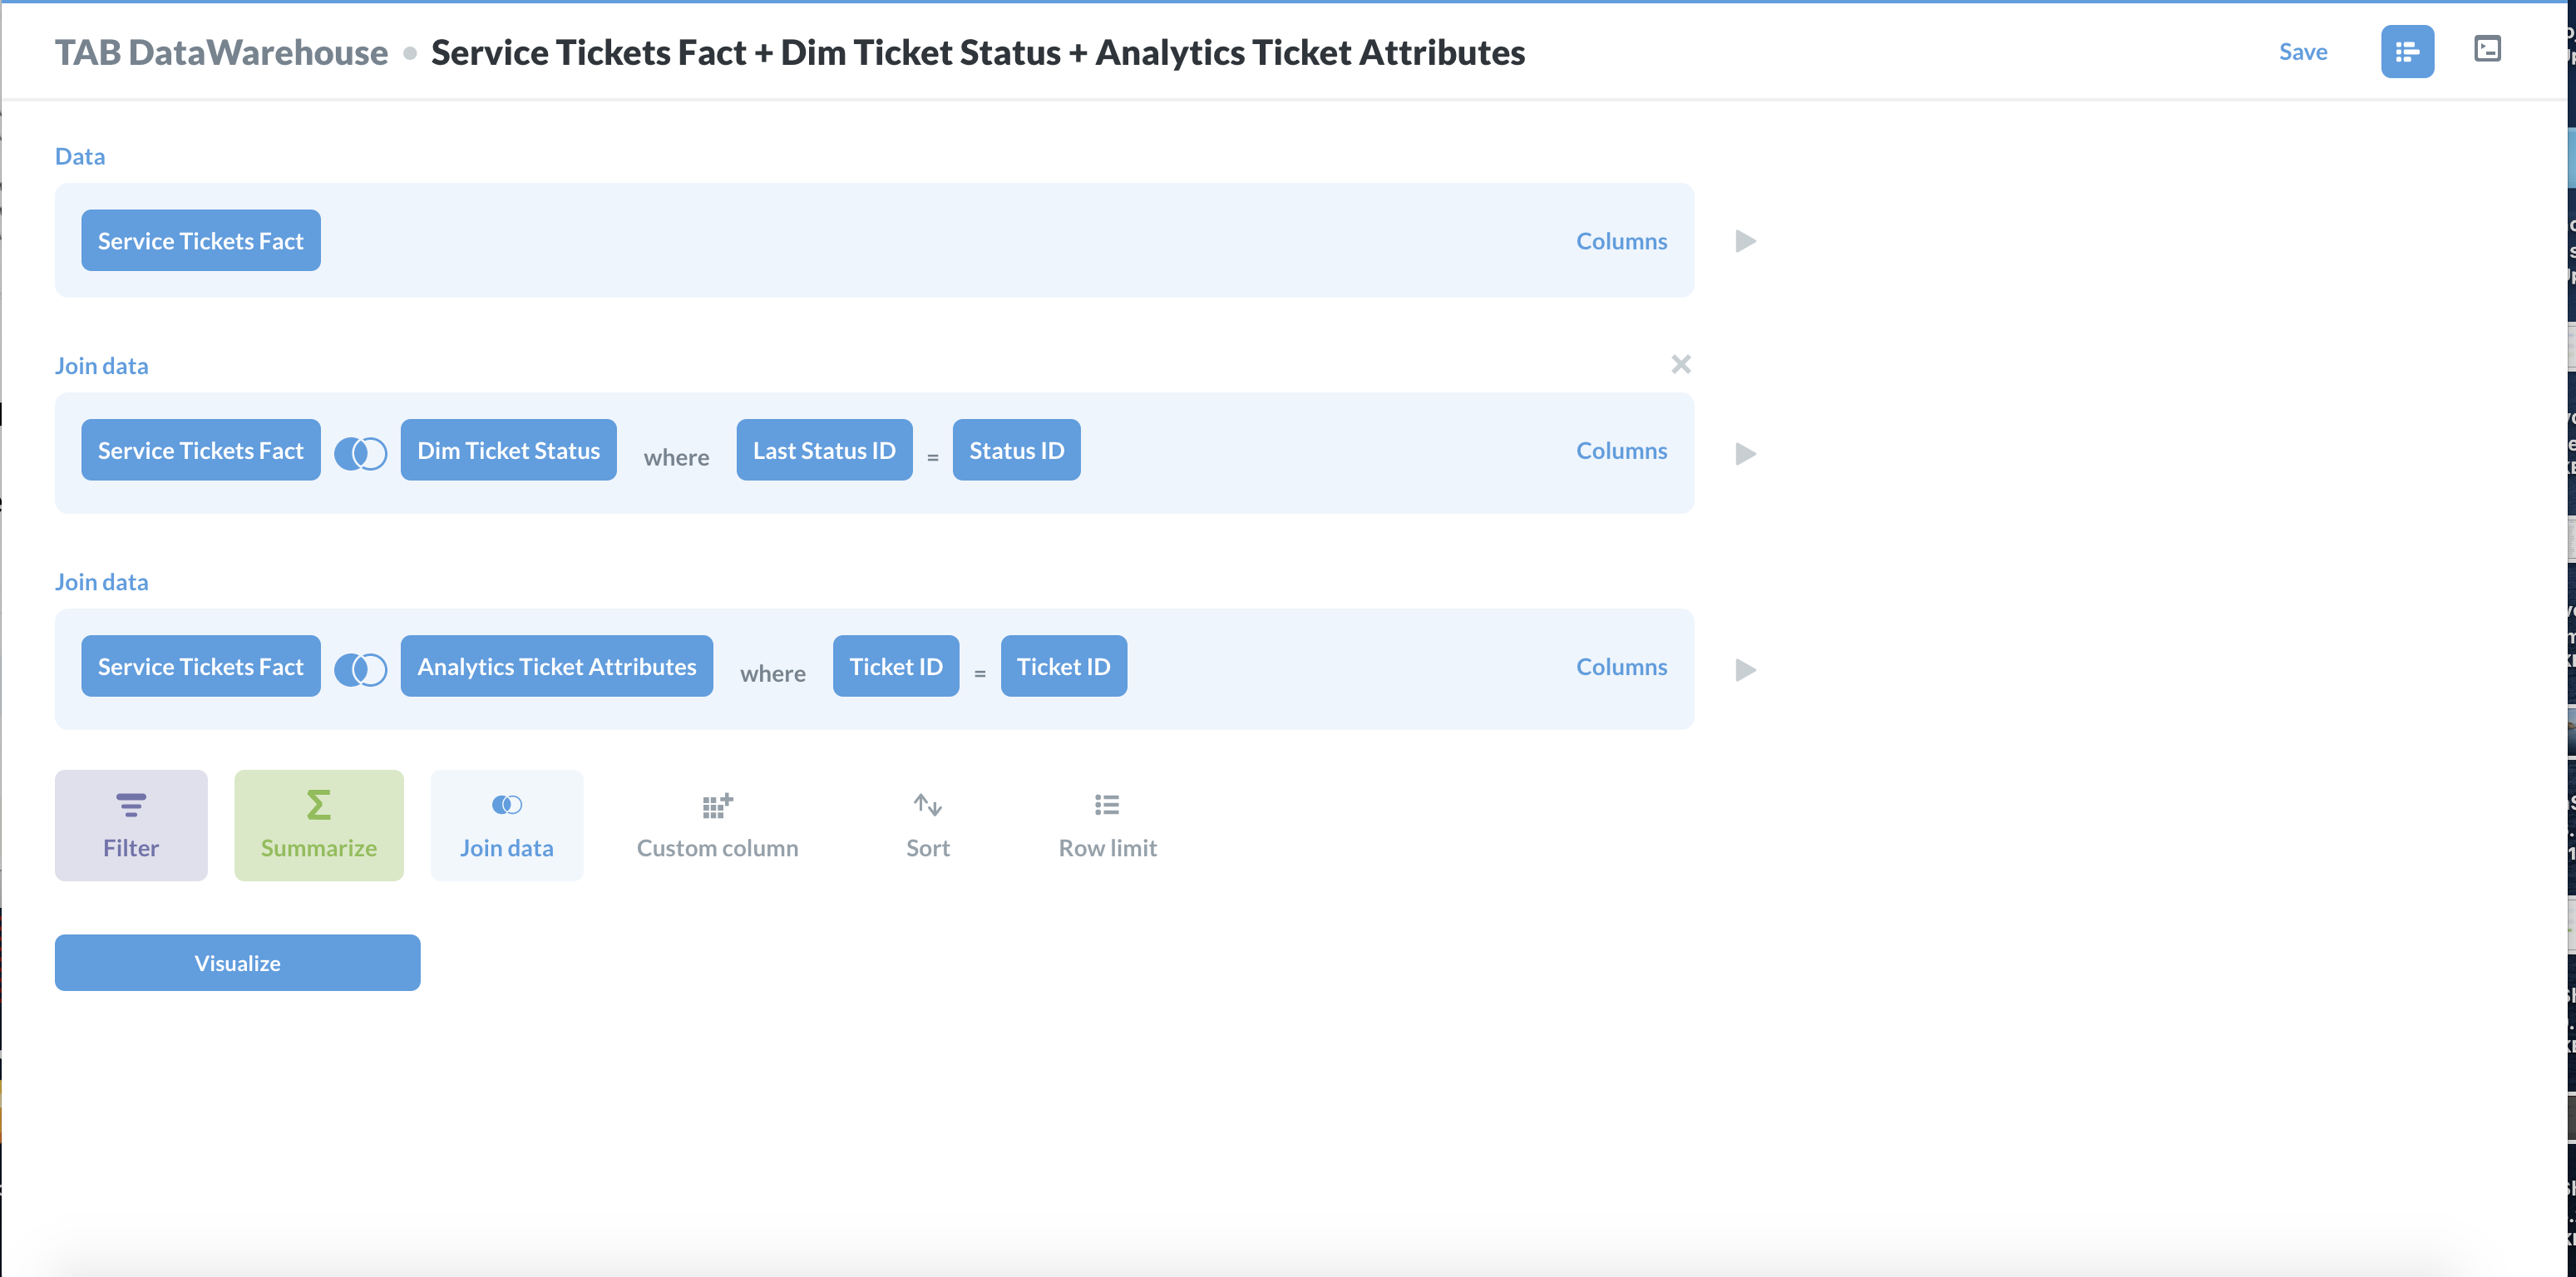
I created another very similar table but for all of my service tickets. I began with the Service Tickets table and joined it with both the Service Tickets Fact table and the Analytics Ticket Attributes table. Once again, I clicked on visualization and got rid of all the extra columns I did not need. This gave me a table where I could see dynamic attributes, statuses, ticket details, and updates for each service ticket.
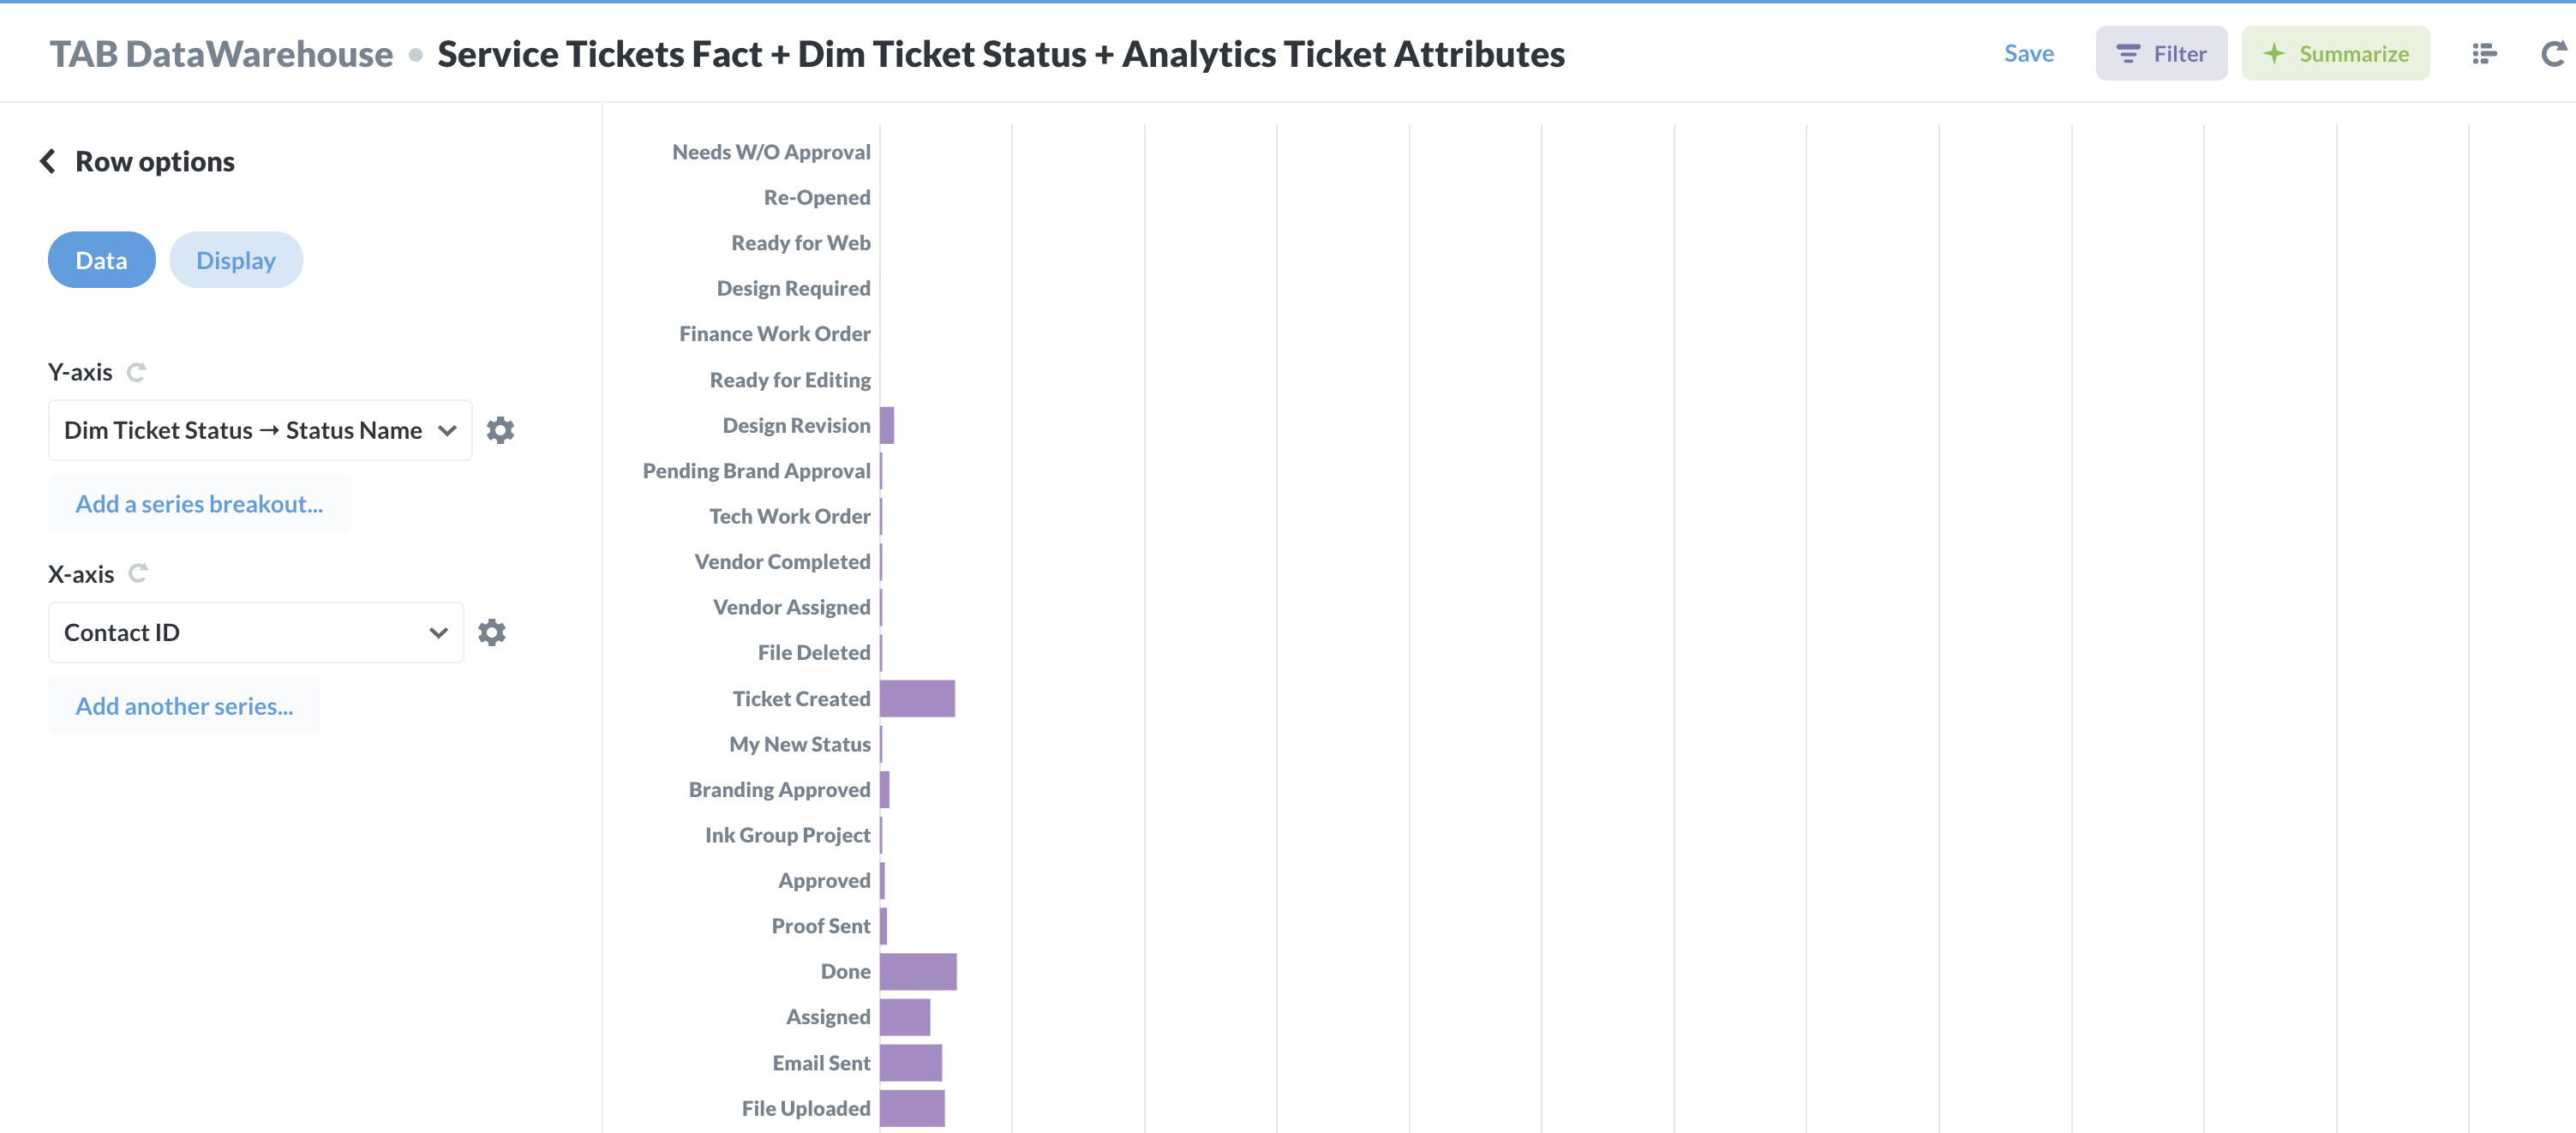
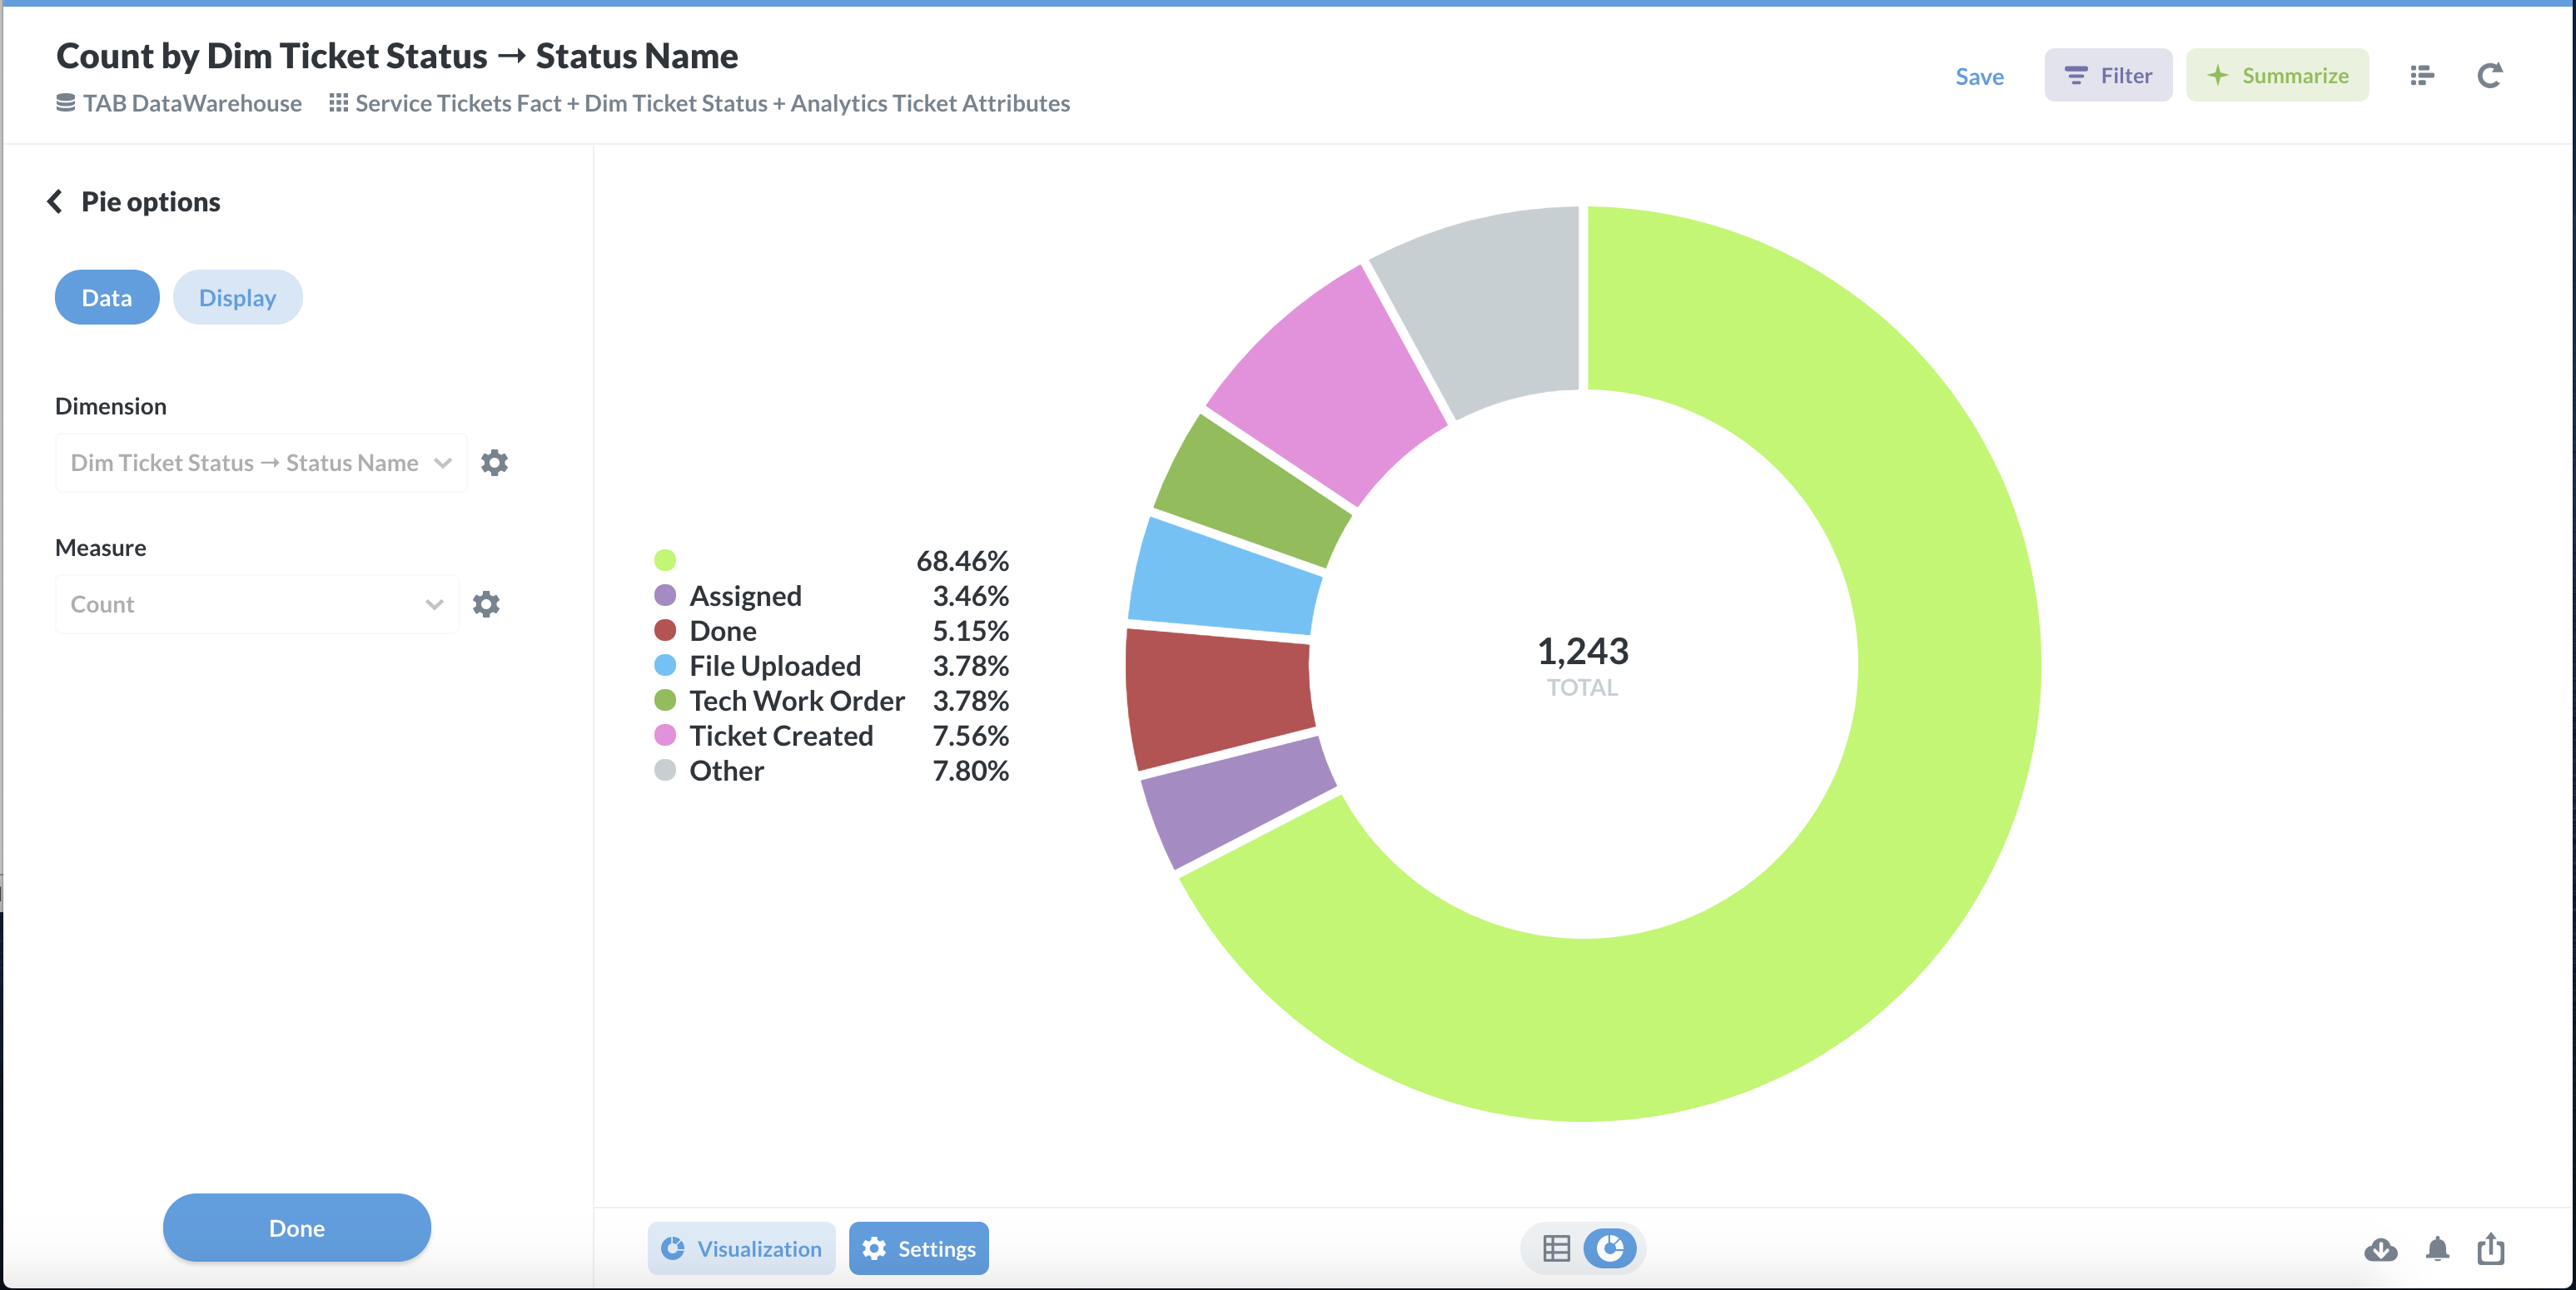
Lastly, I wanted to see how many tickets I have in each status. So, I started with the Service Tickets Facts table and joined it with the Dim Ticket Status table. I then summarized the data by count, grouped by status name.
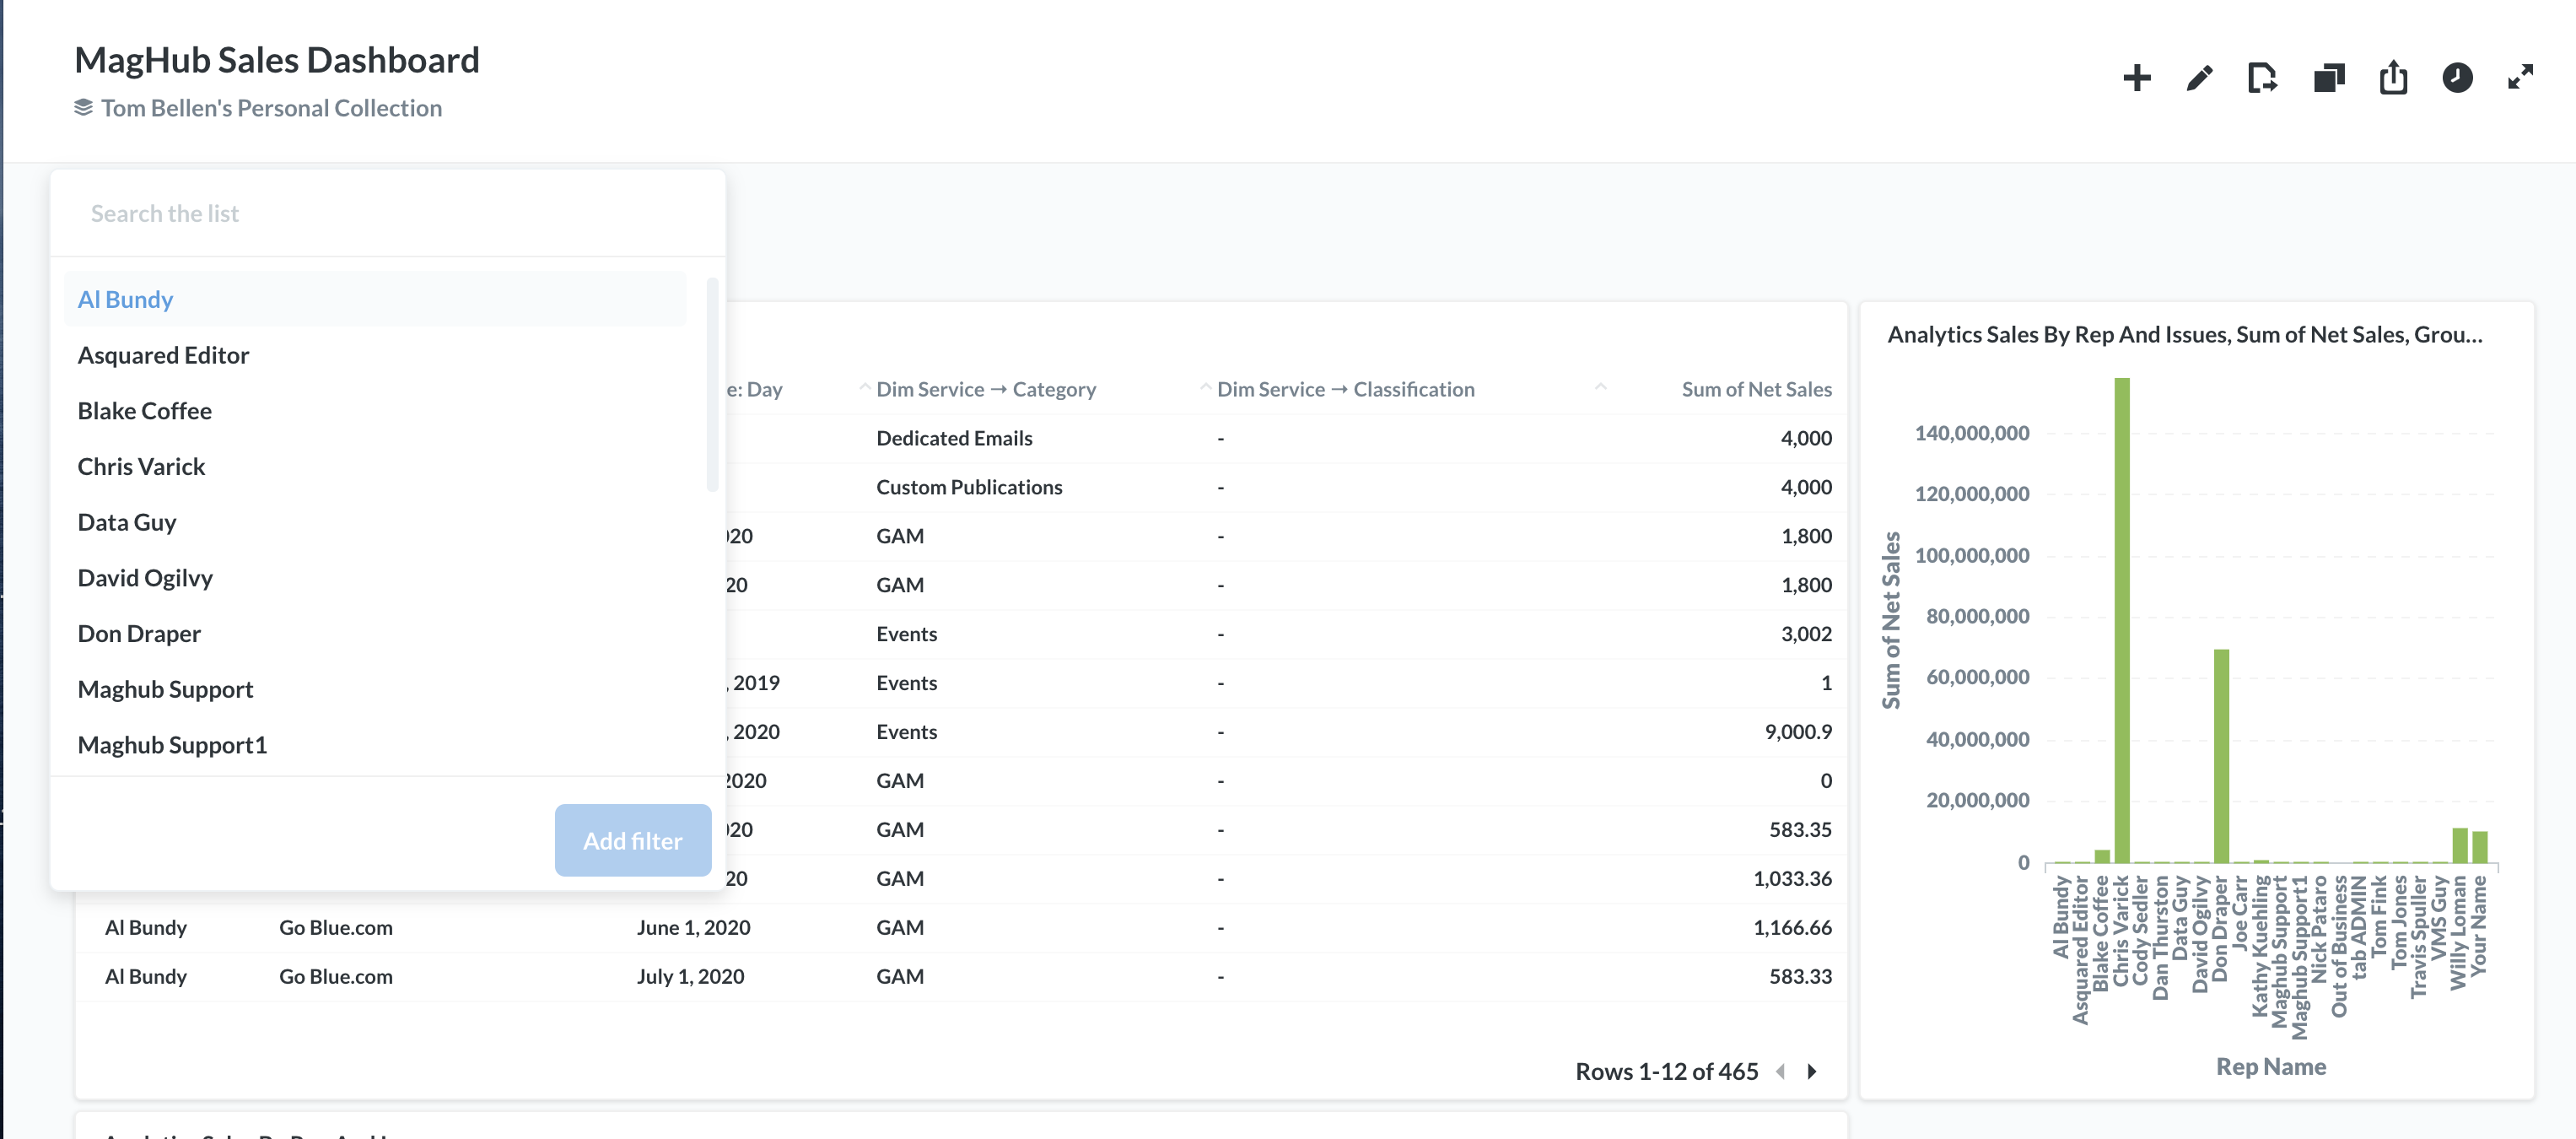
The Dashboards in Metabase allow you to view and filter multiple tables. For instance, you could create a sales dashboard with the tables Analytics Sales by Rep and Issue, Analytics Sales by Rep and Service, Analytics Sales, and Analytics Sales Summary. From the dashboard, you can add filters to multiple tables at once. You could add a Sales Rep filter, so you can see how your sales reps are performing, and easily choose which reps information to display. You could also add a Company Name filter, which would allow you to sort the data by a specific company. Another filter that may be useful is the Relative Date filter. As opposed to other date ranges, the Relative Date range is constantly updating. For example, you could choose the ‘last month’ option, and it will always show the month previous to the current one, as opposed to always showing a specific month.
You could leave the tables exactly as they are and still get a good summary view of your sales data, or you could go further and edit each table so you can really personalize your dashboard.
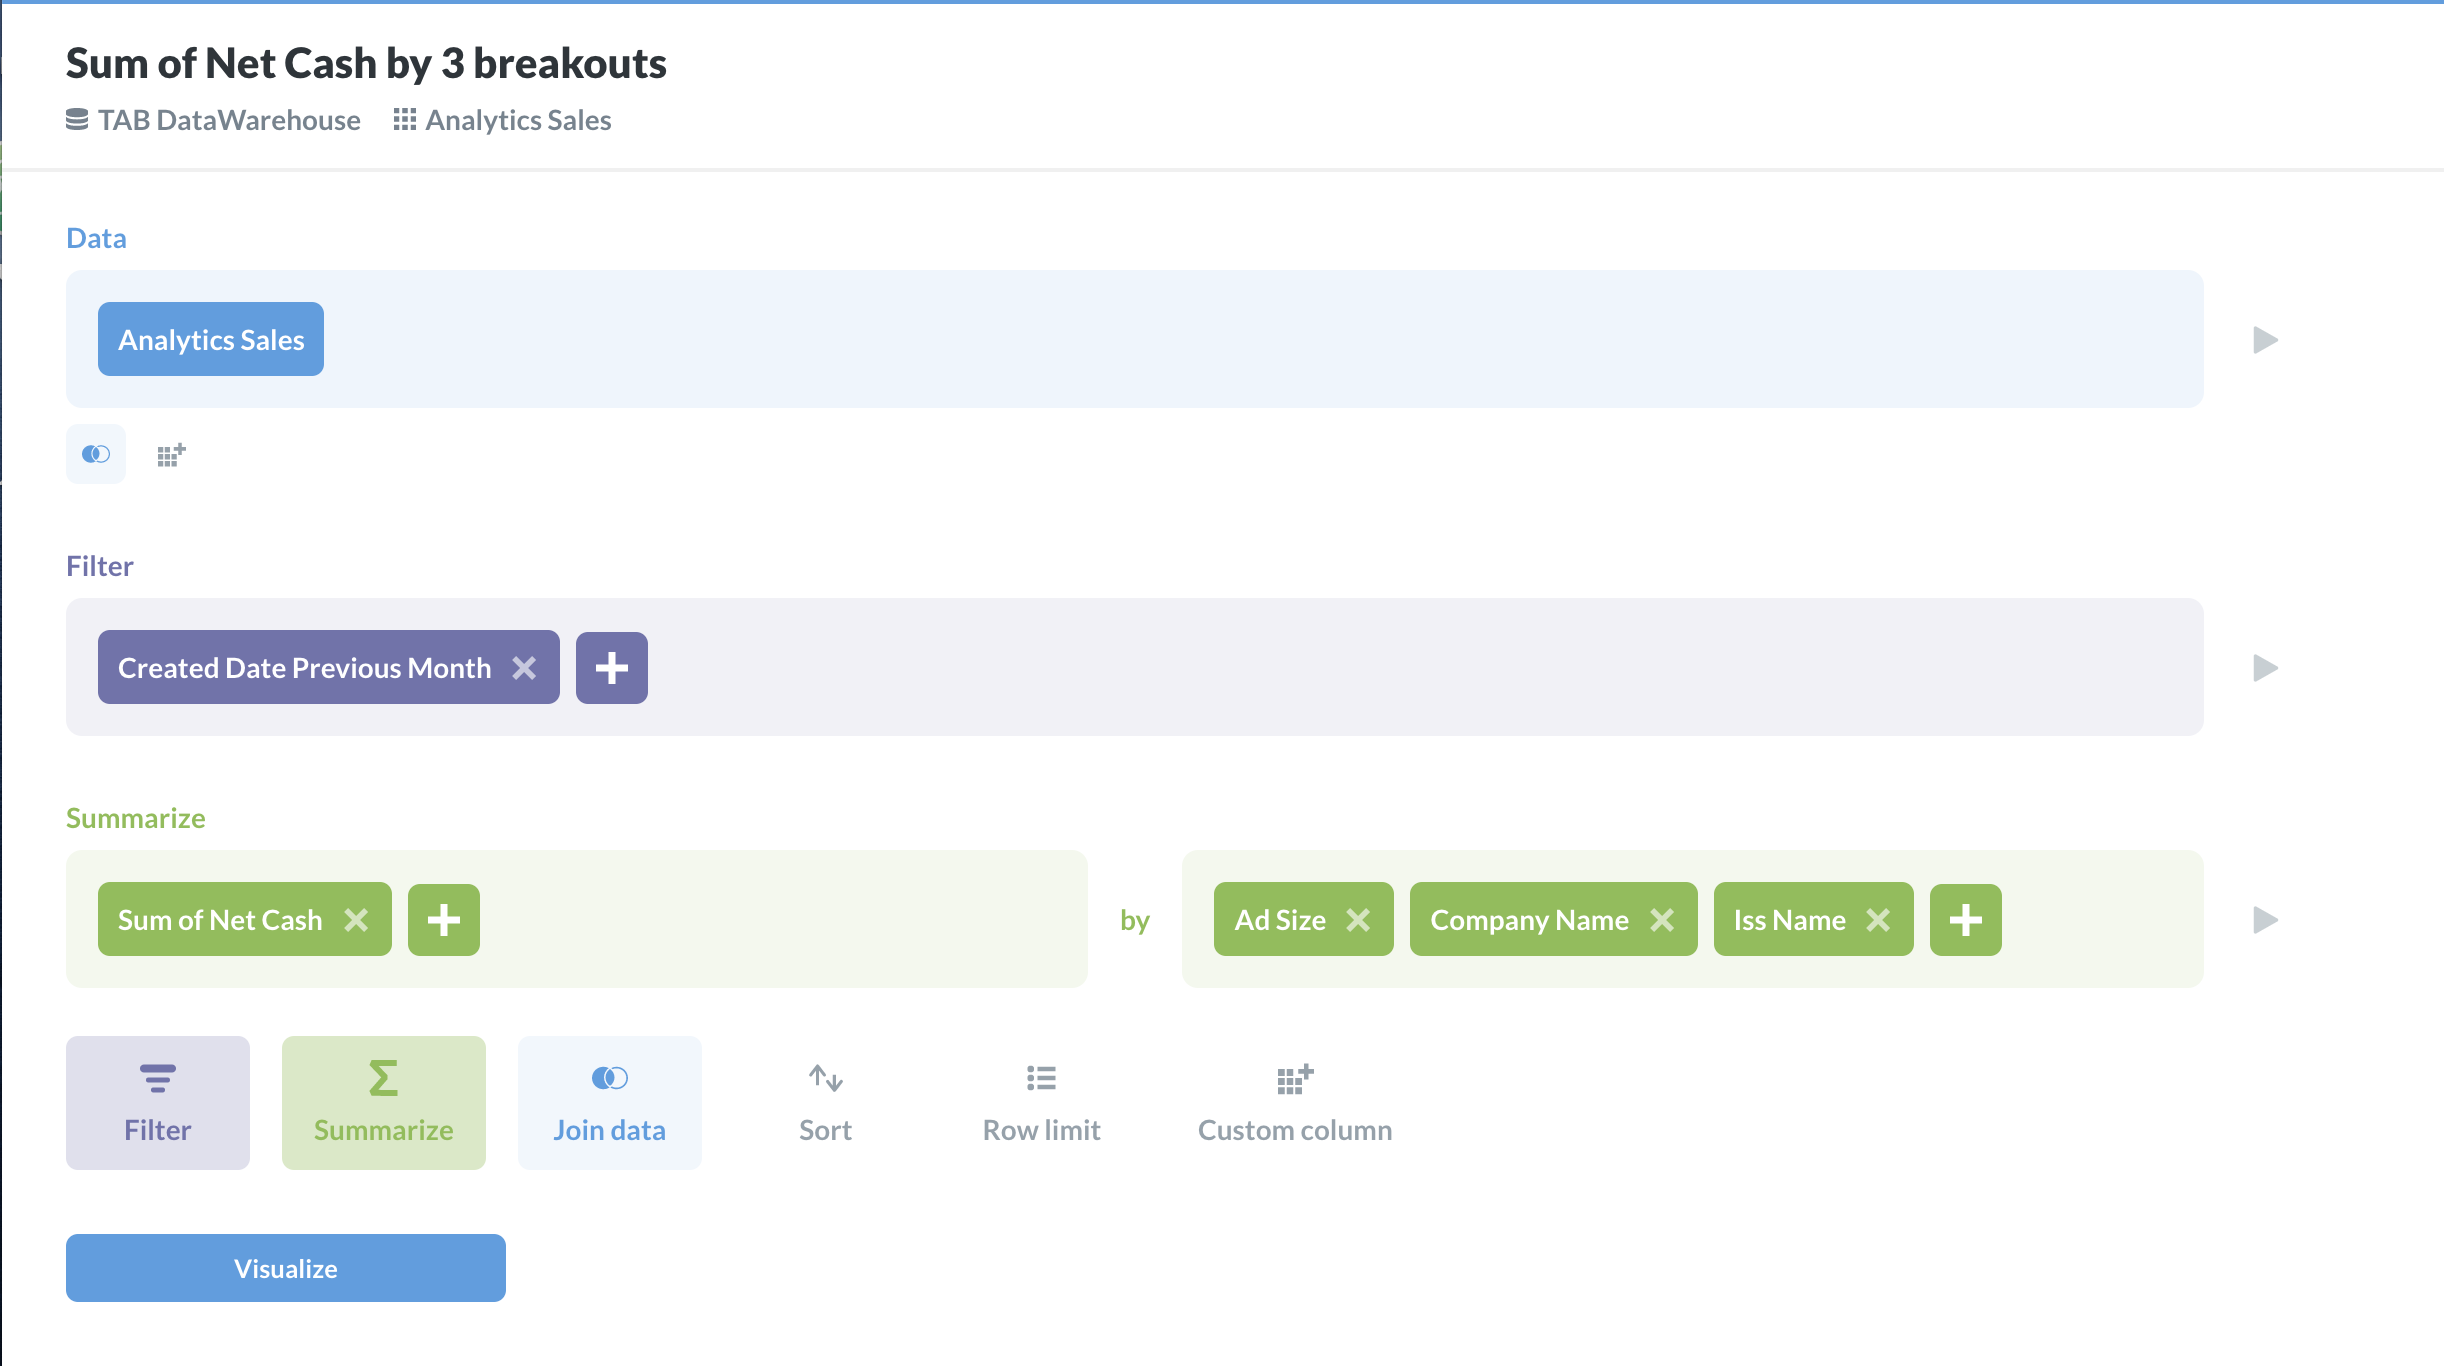
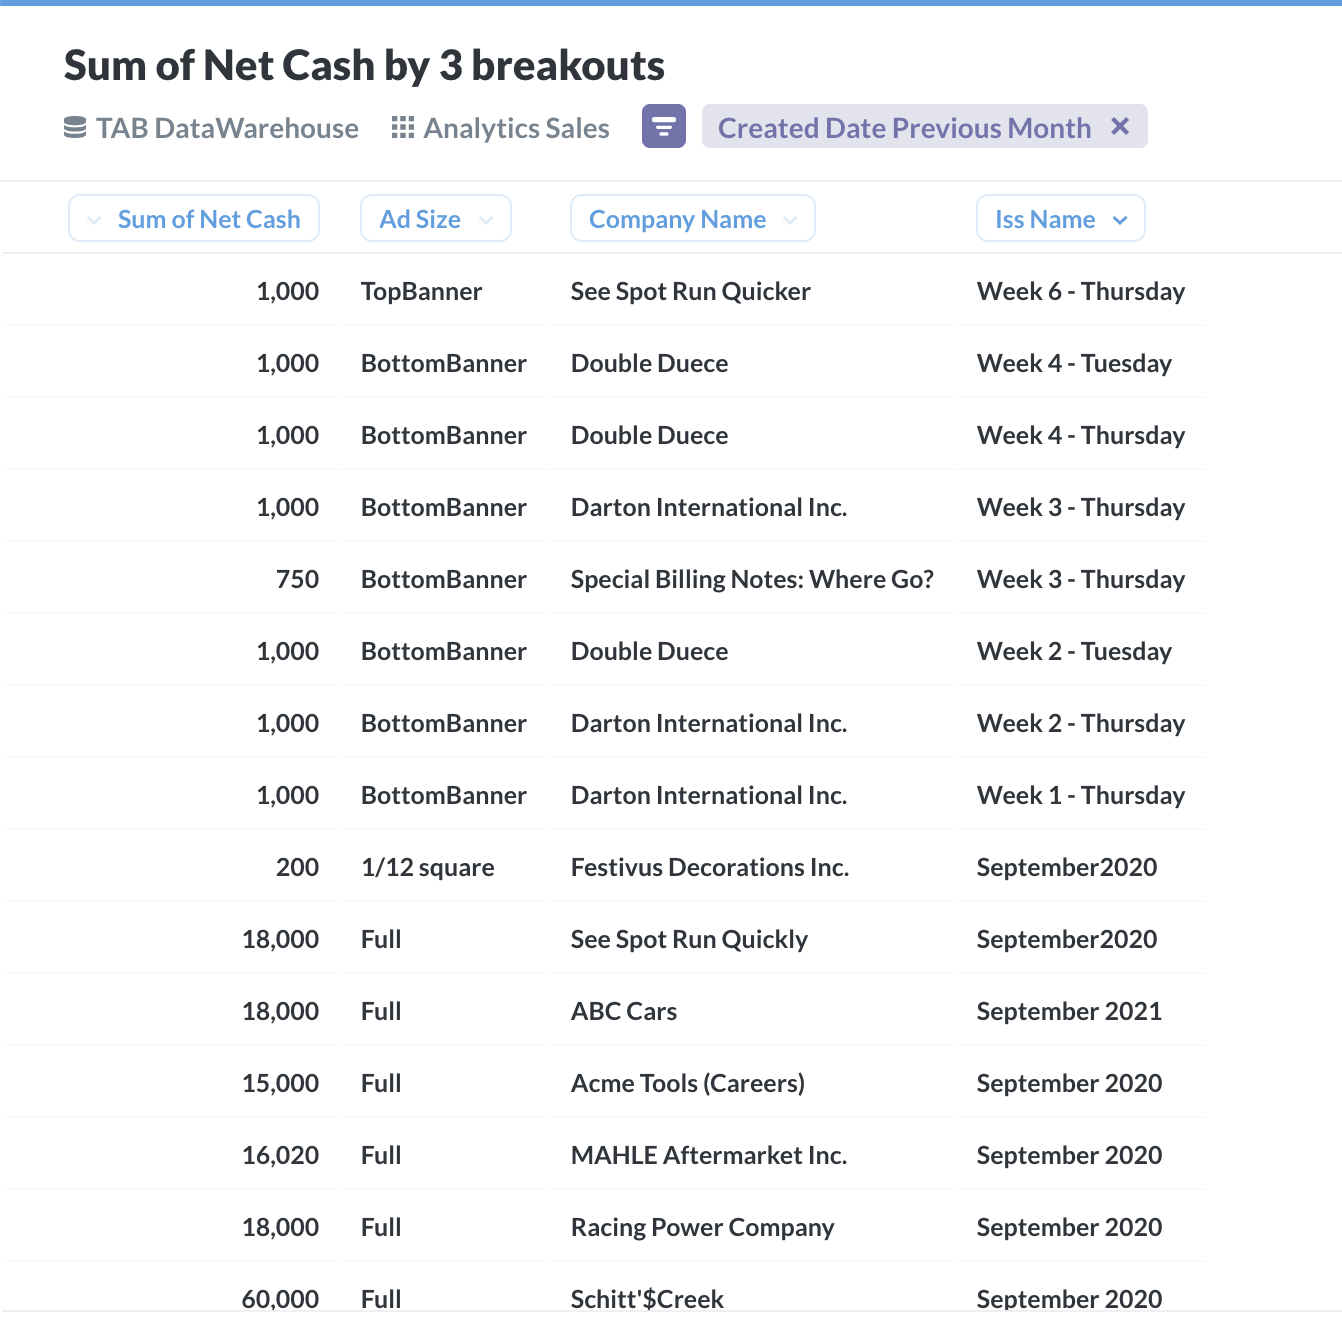
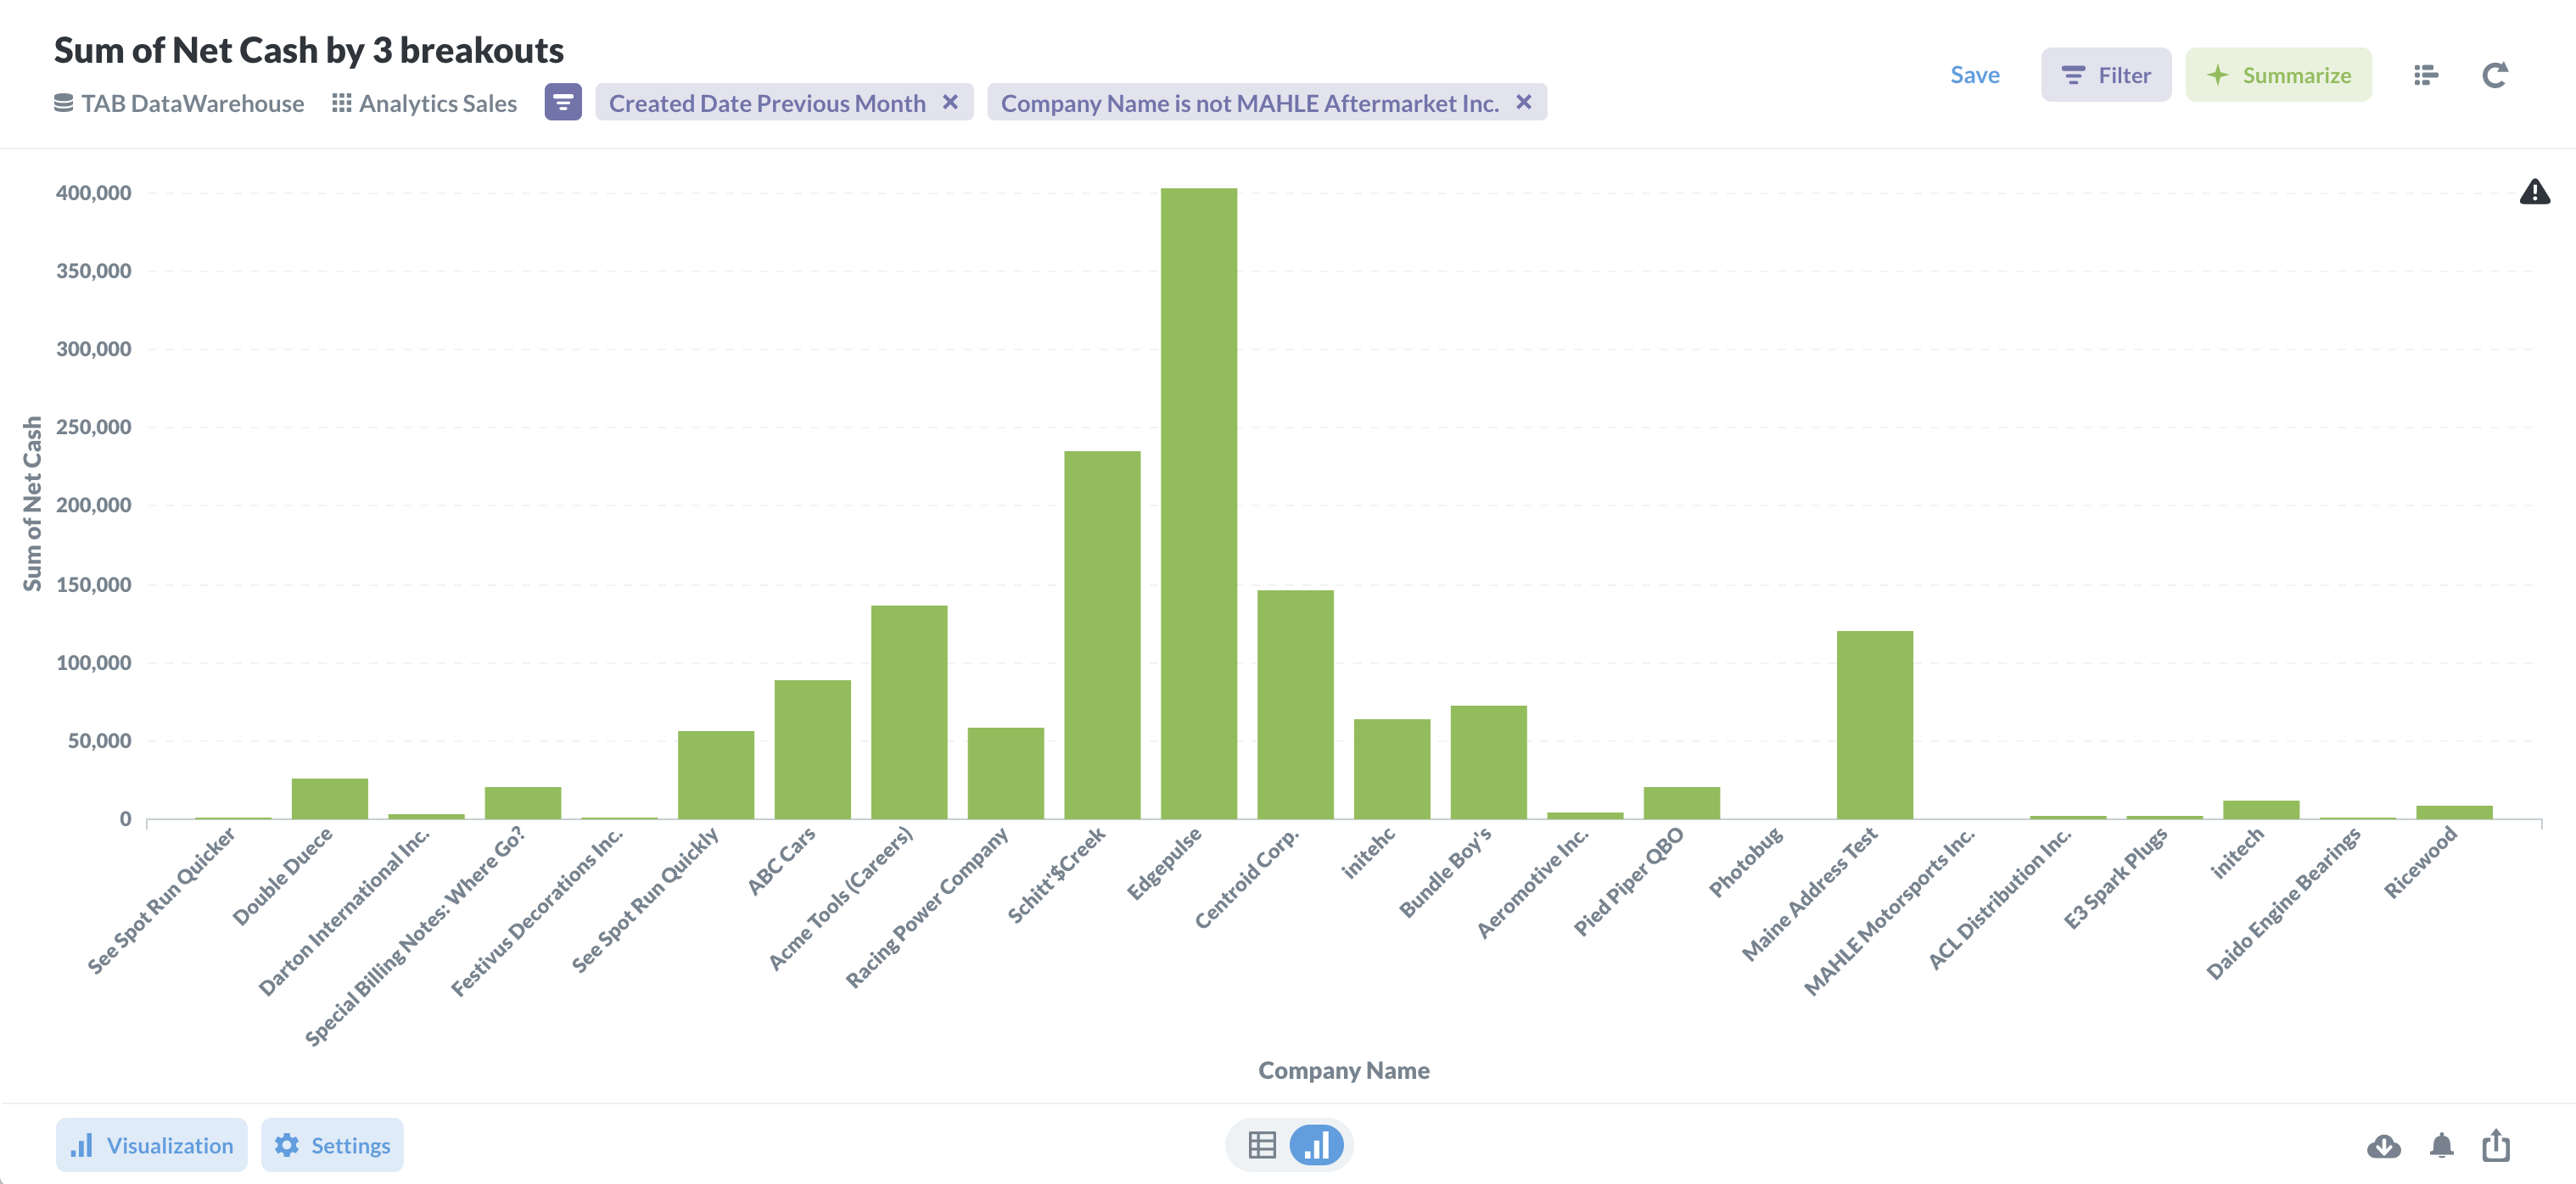
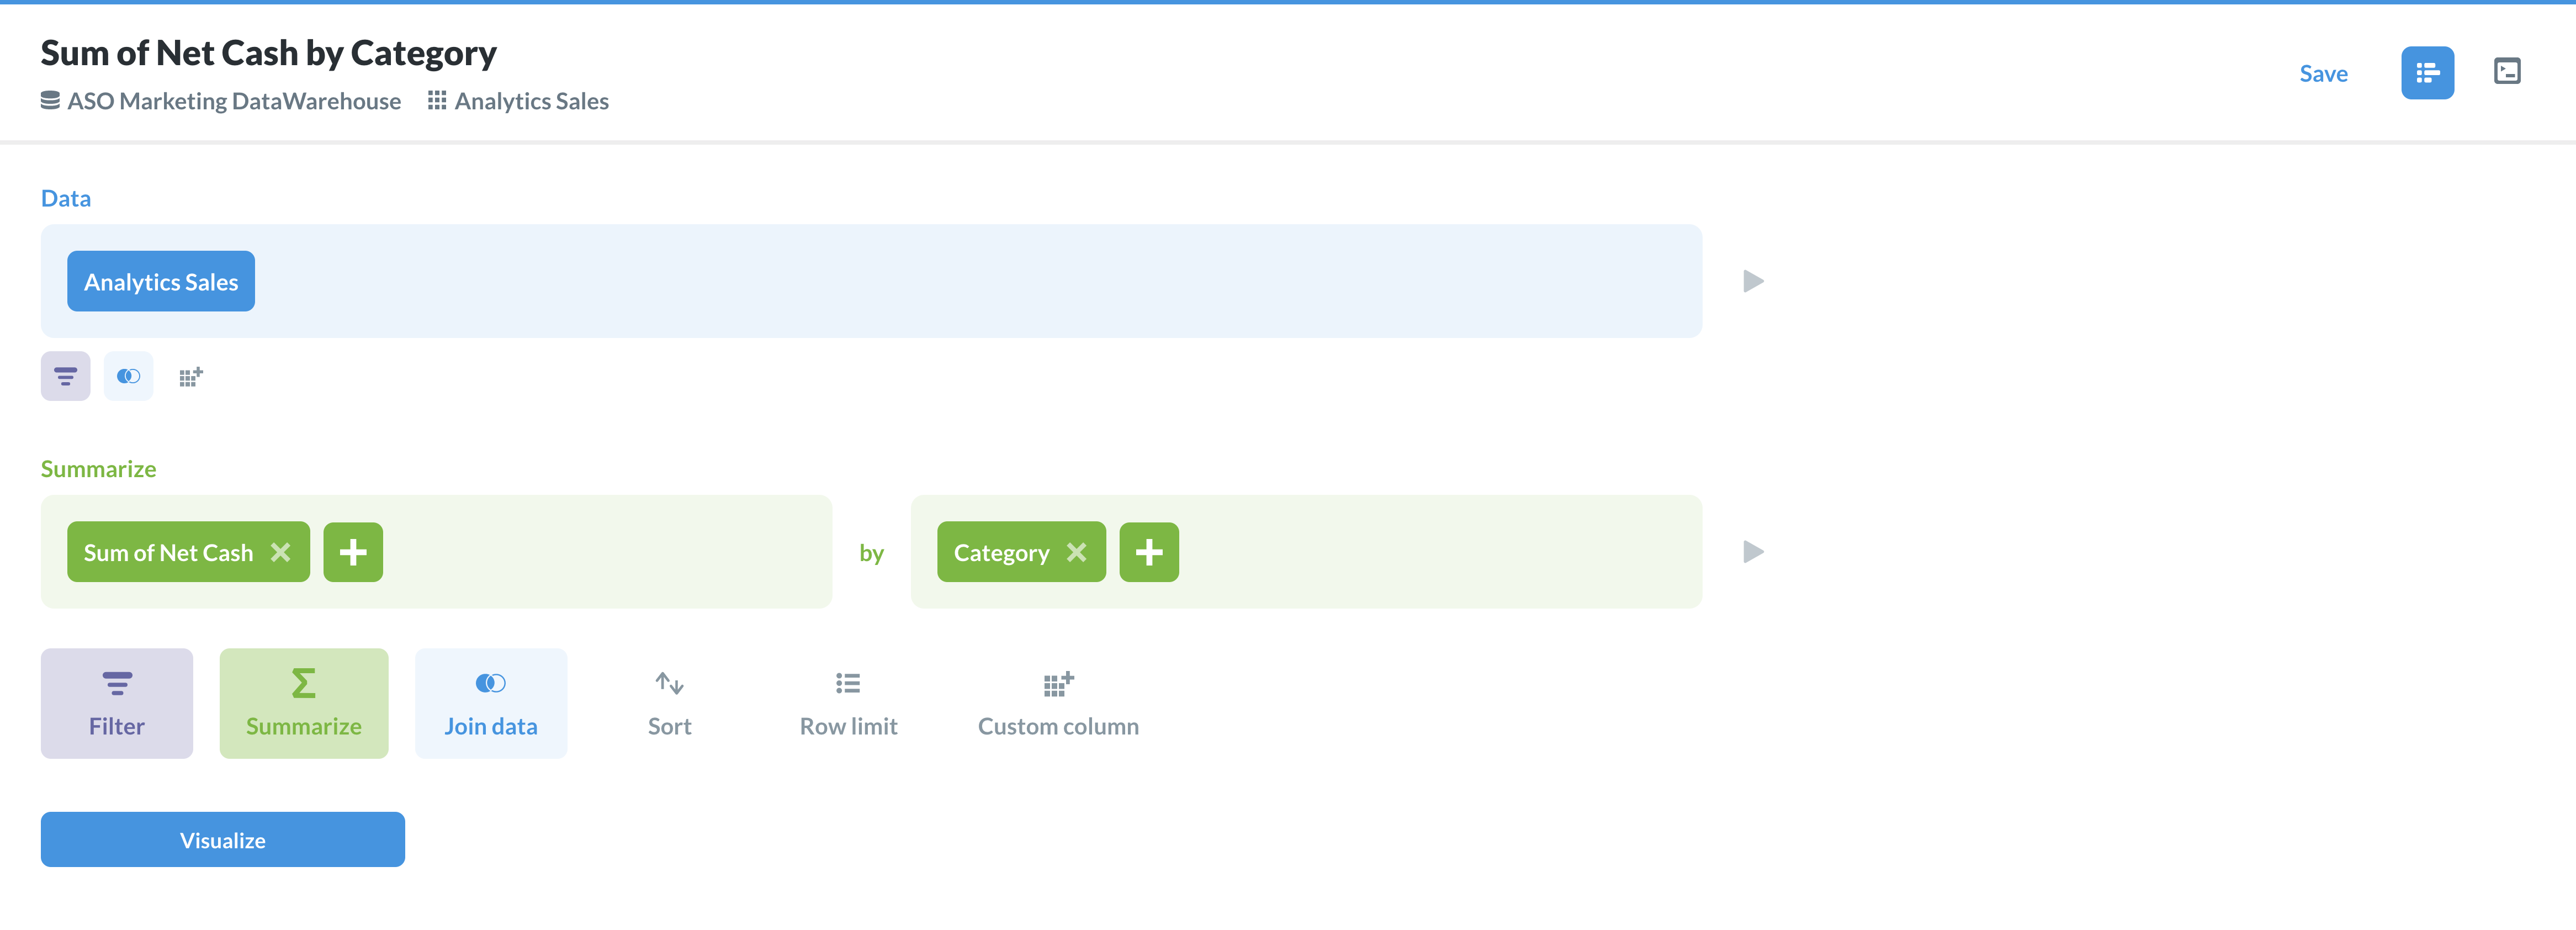
I took my Analytics Sales table and changed it so that I can see a bar chart of my net cash broken down by company, issue, and ad size.
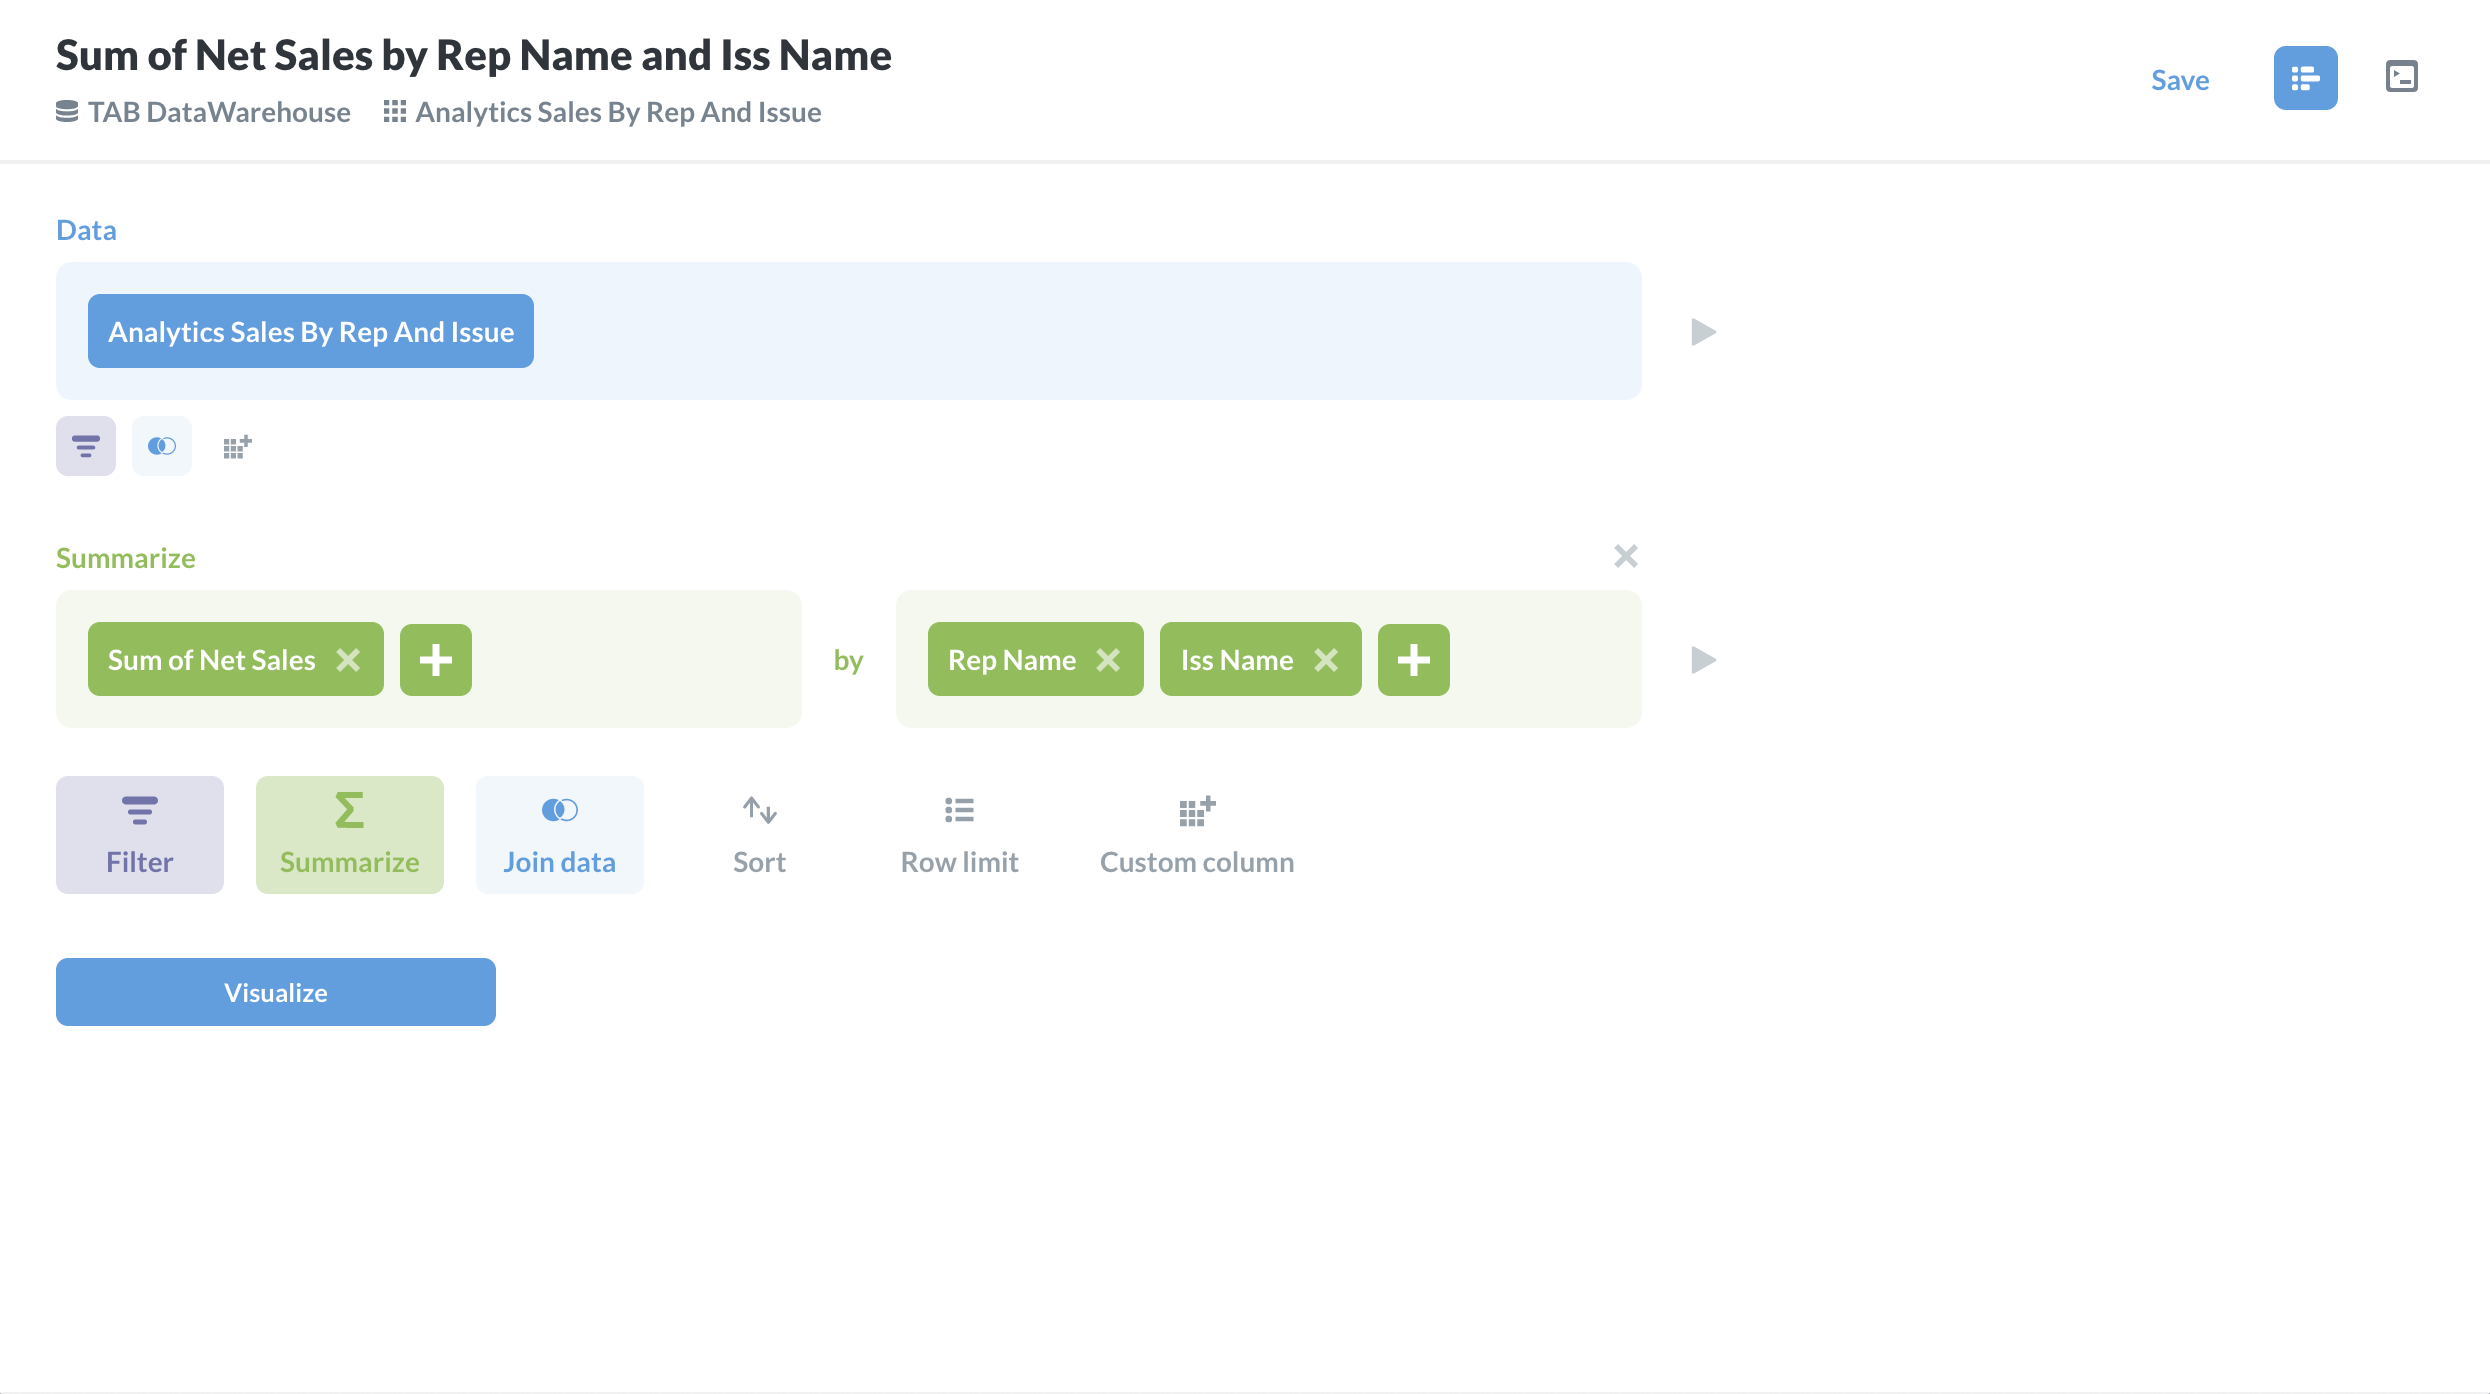
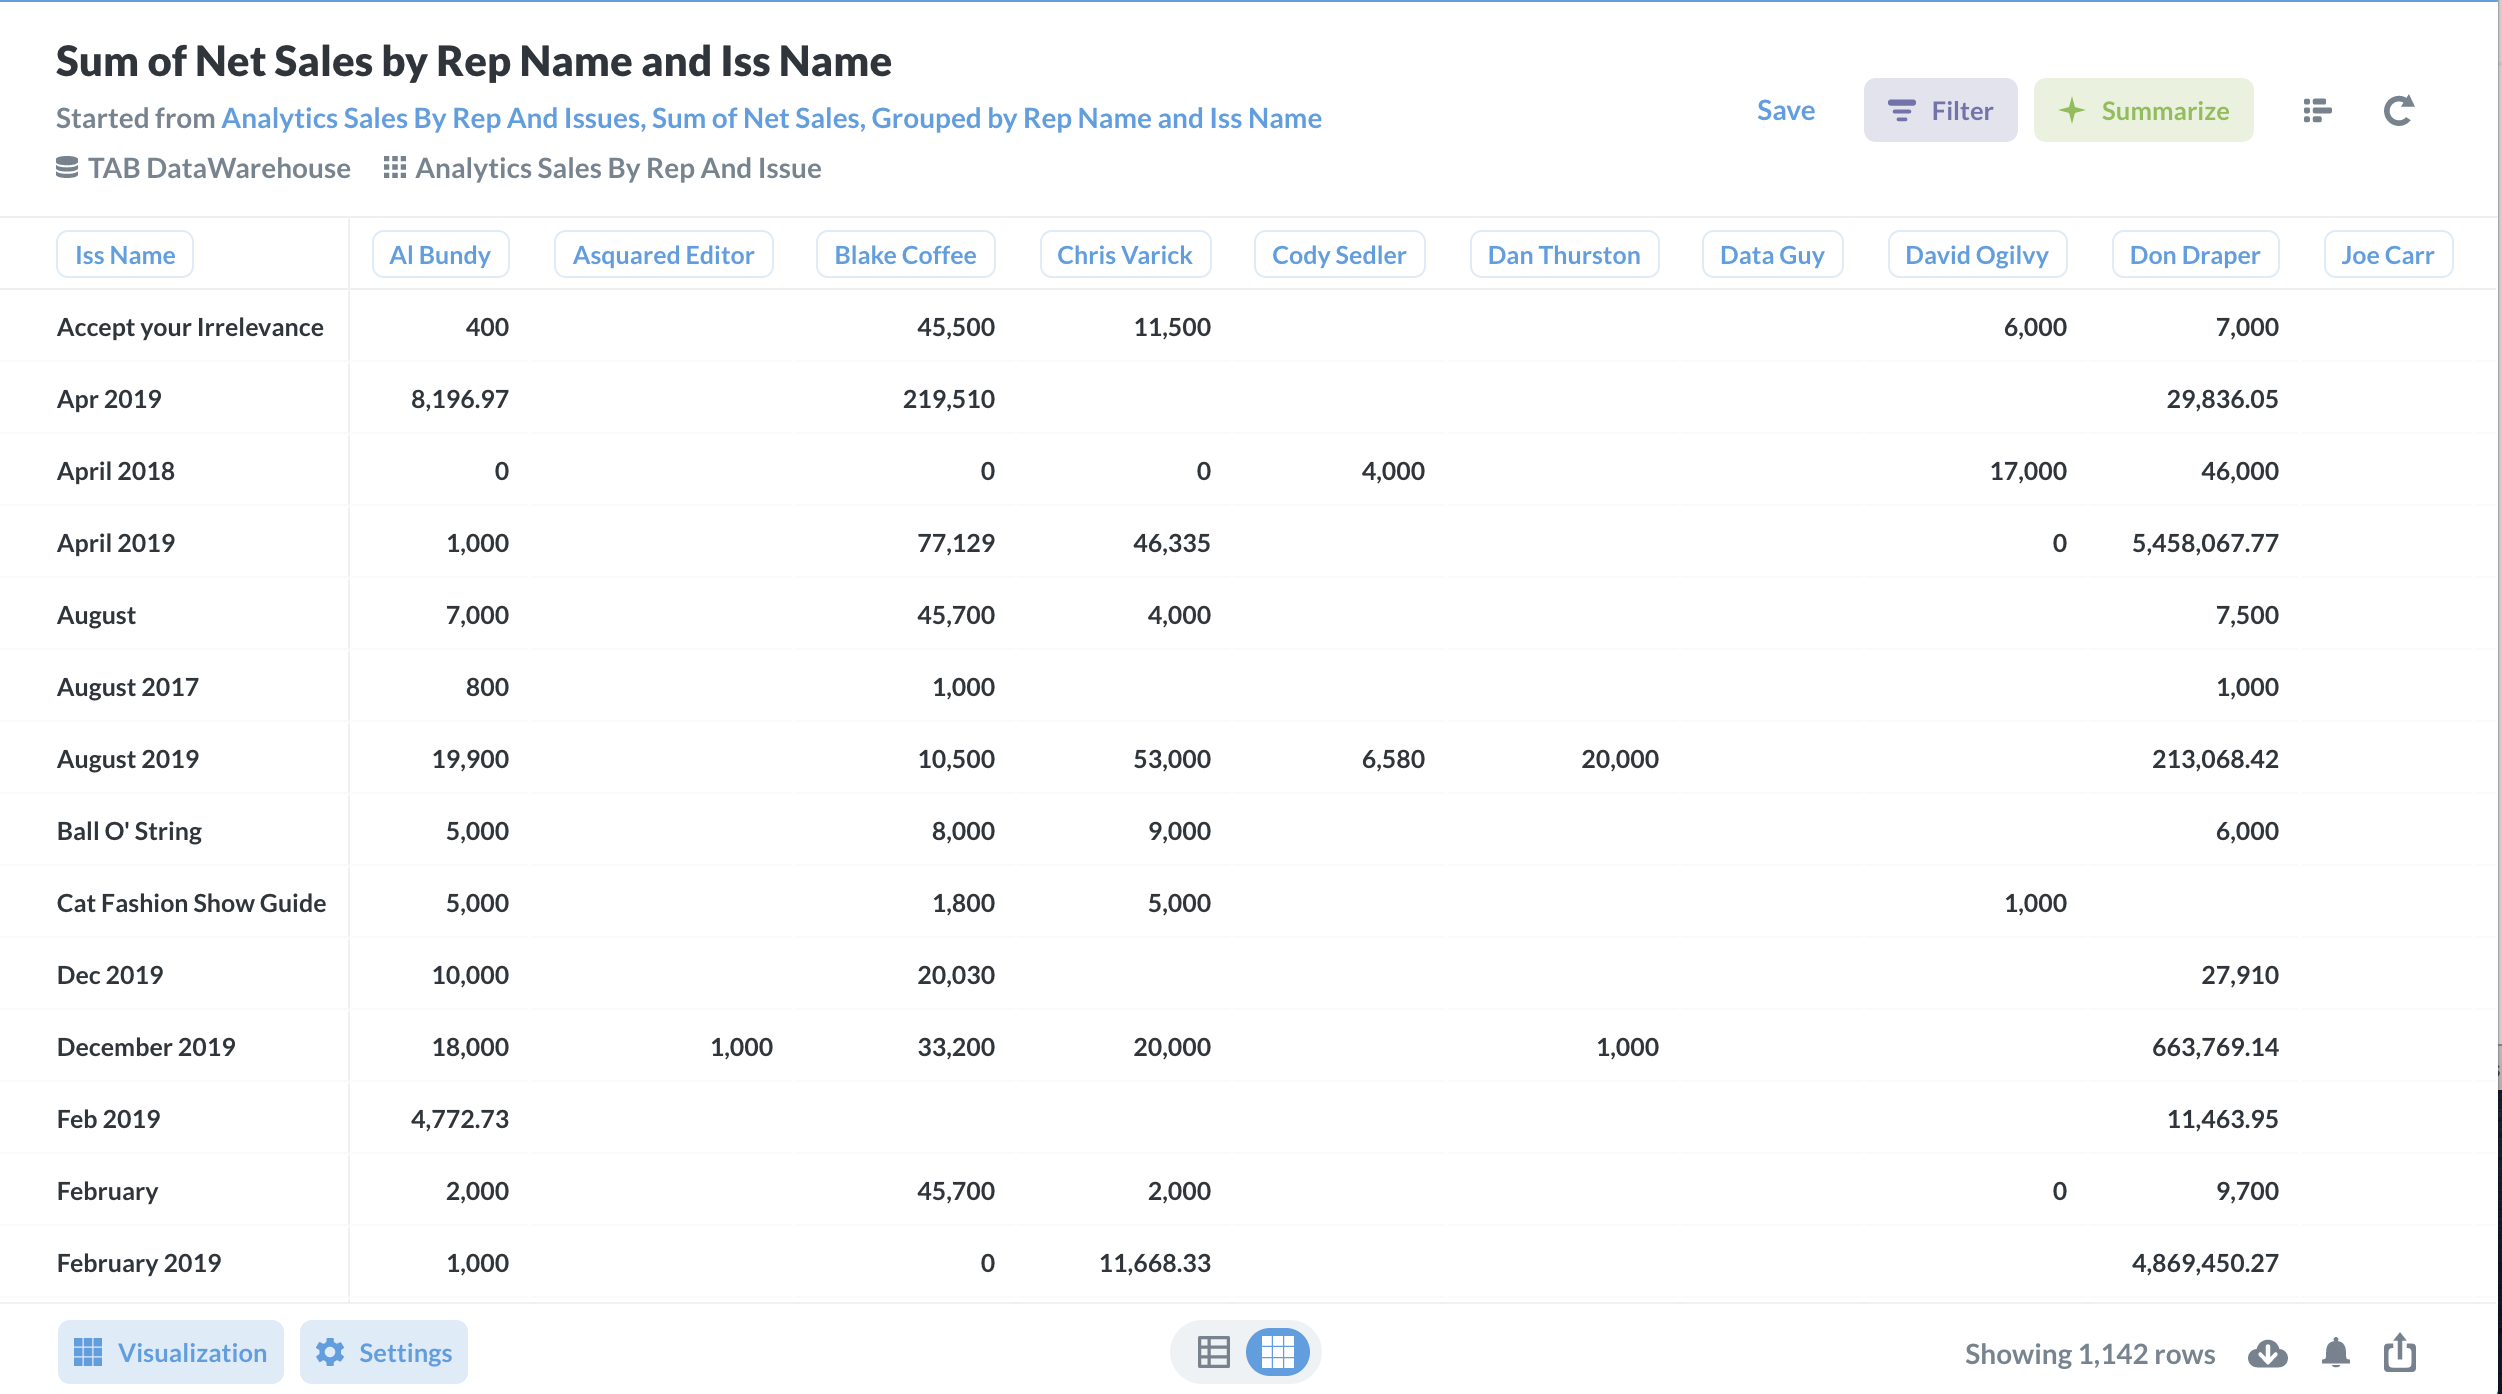
Next, I edited my Analytics Sales by Rep and Issue table. Let’s say I don’t use any barter transactions, and I don’t want to see any pending sales. I could summarize my results to see a sum of net sales, sorted by rep and issue.
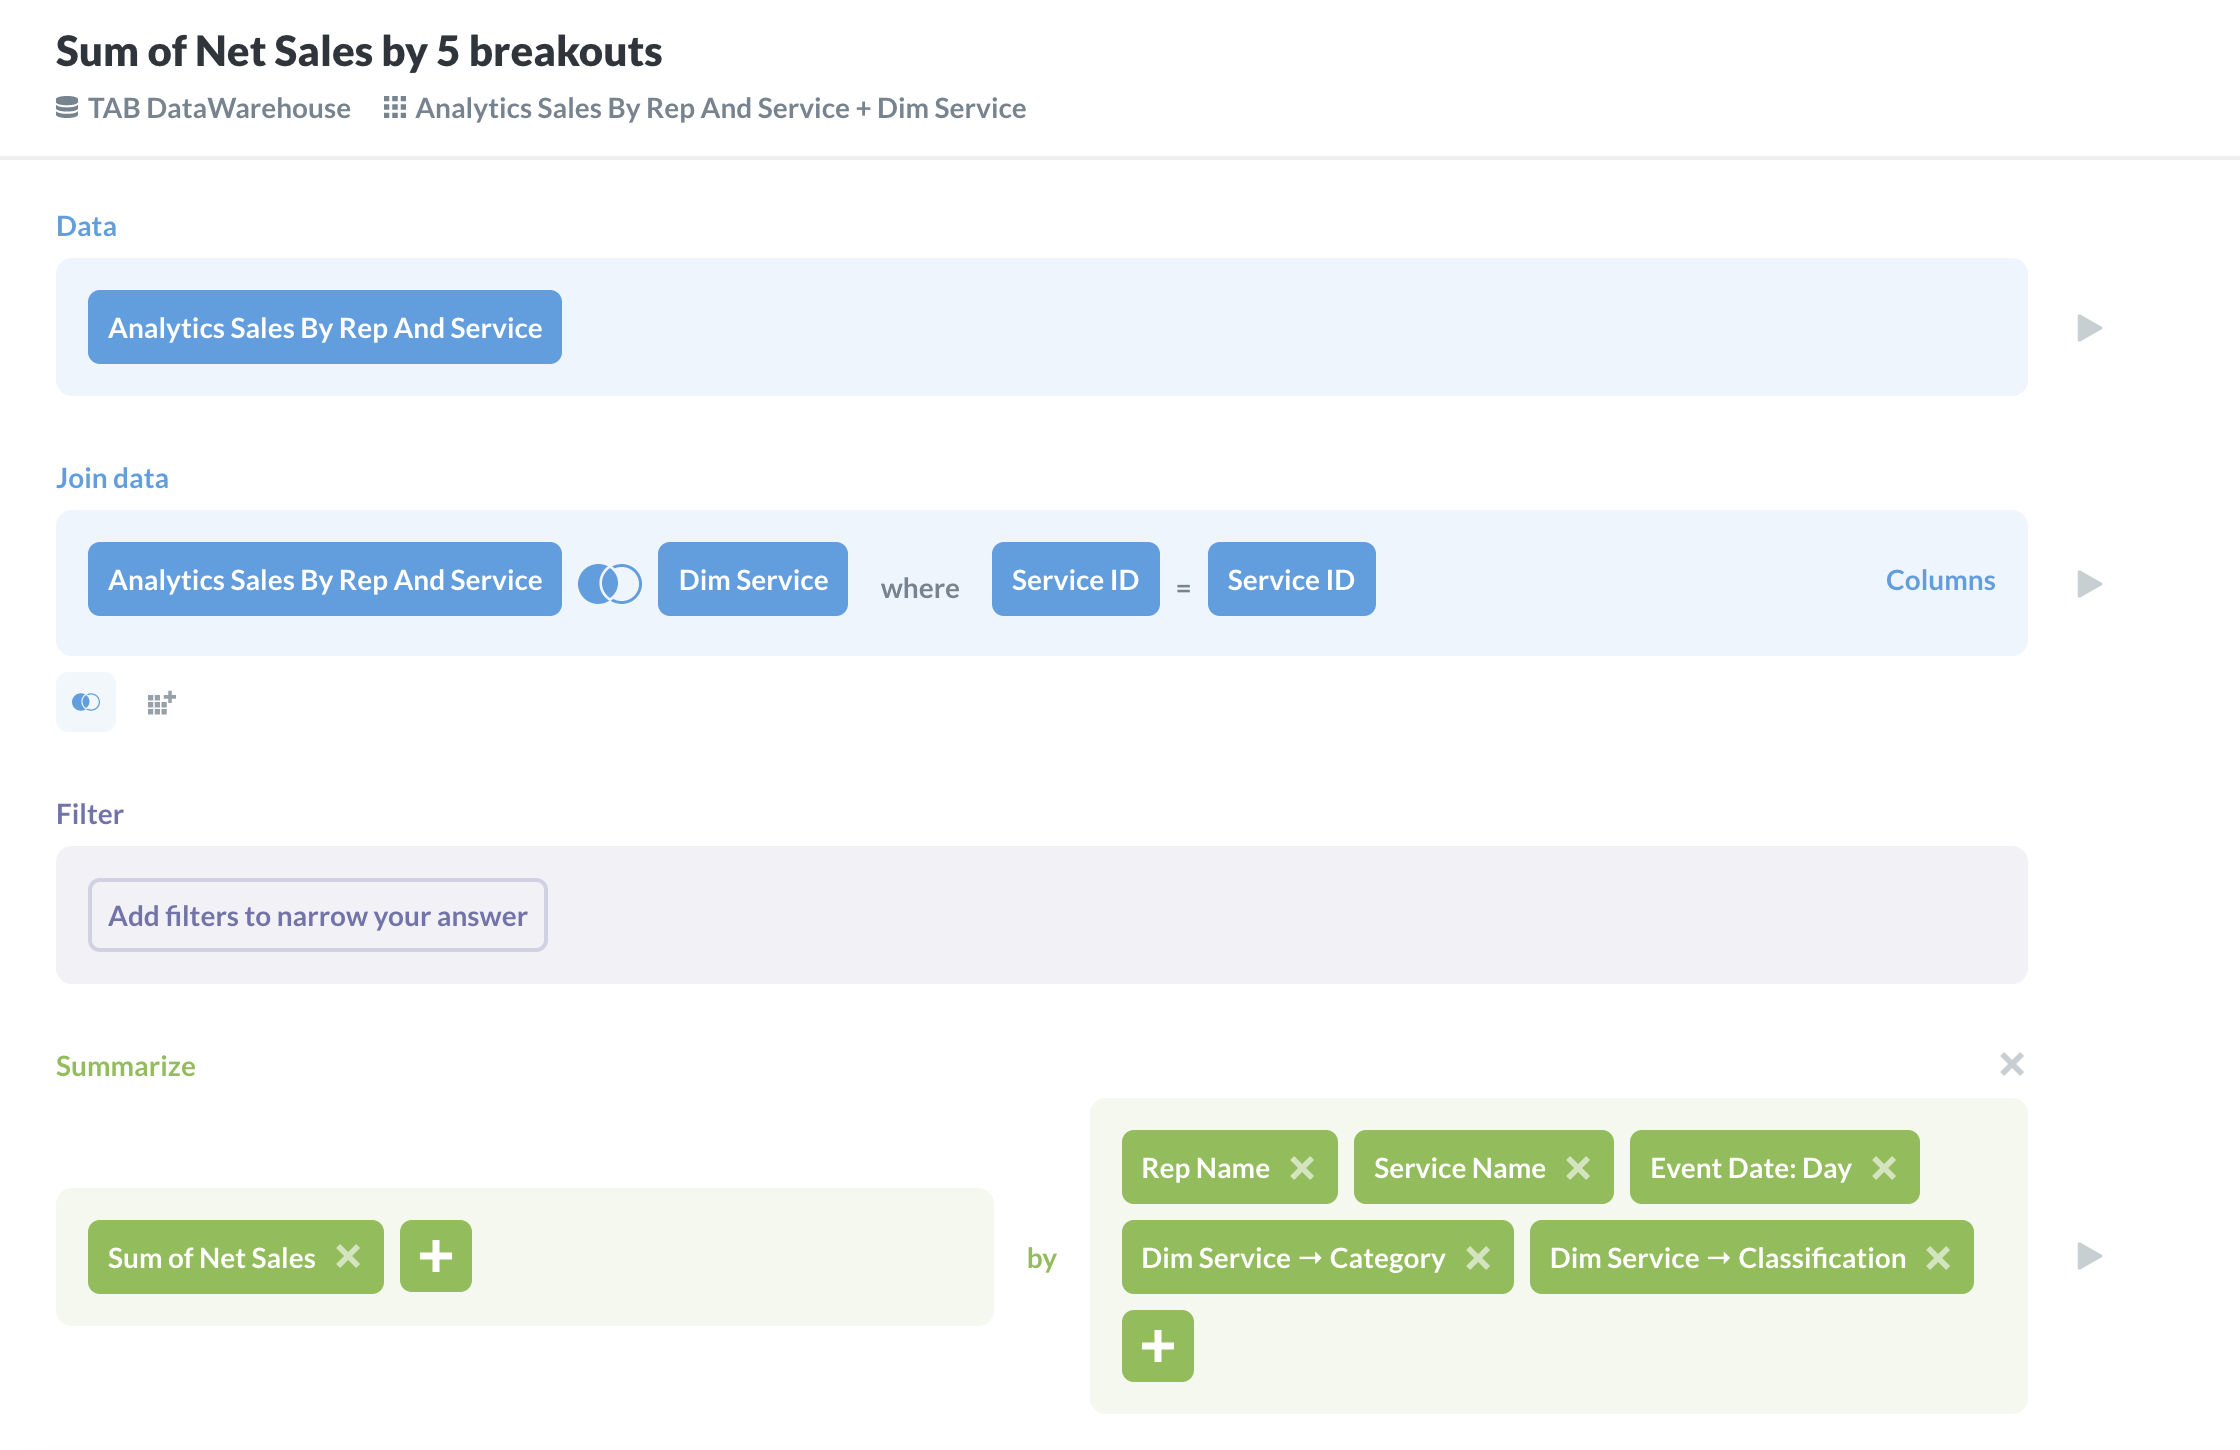
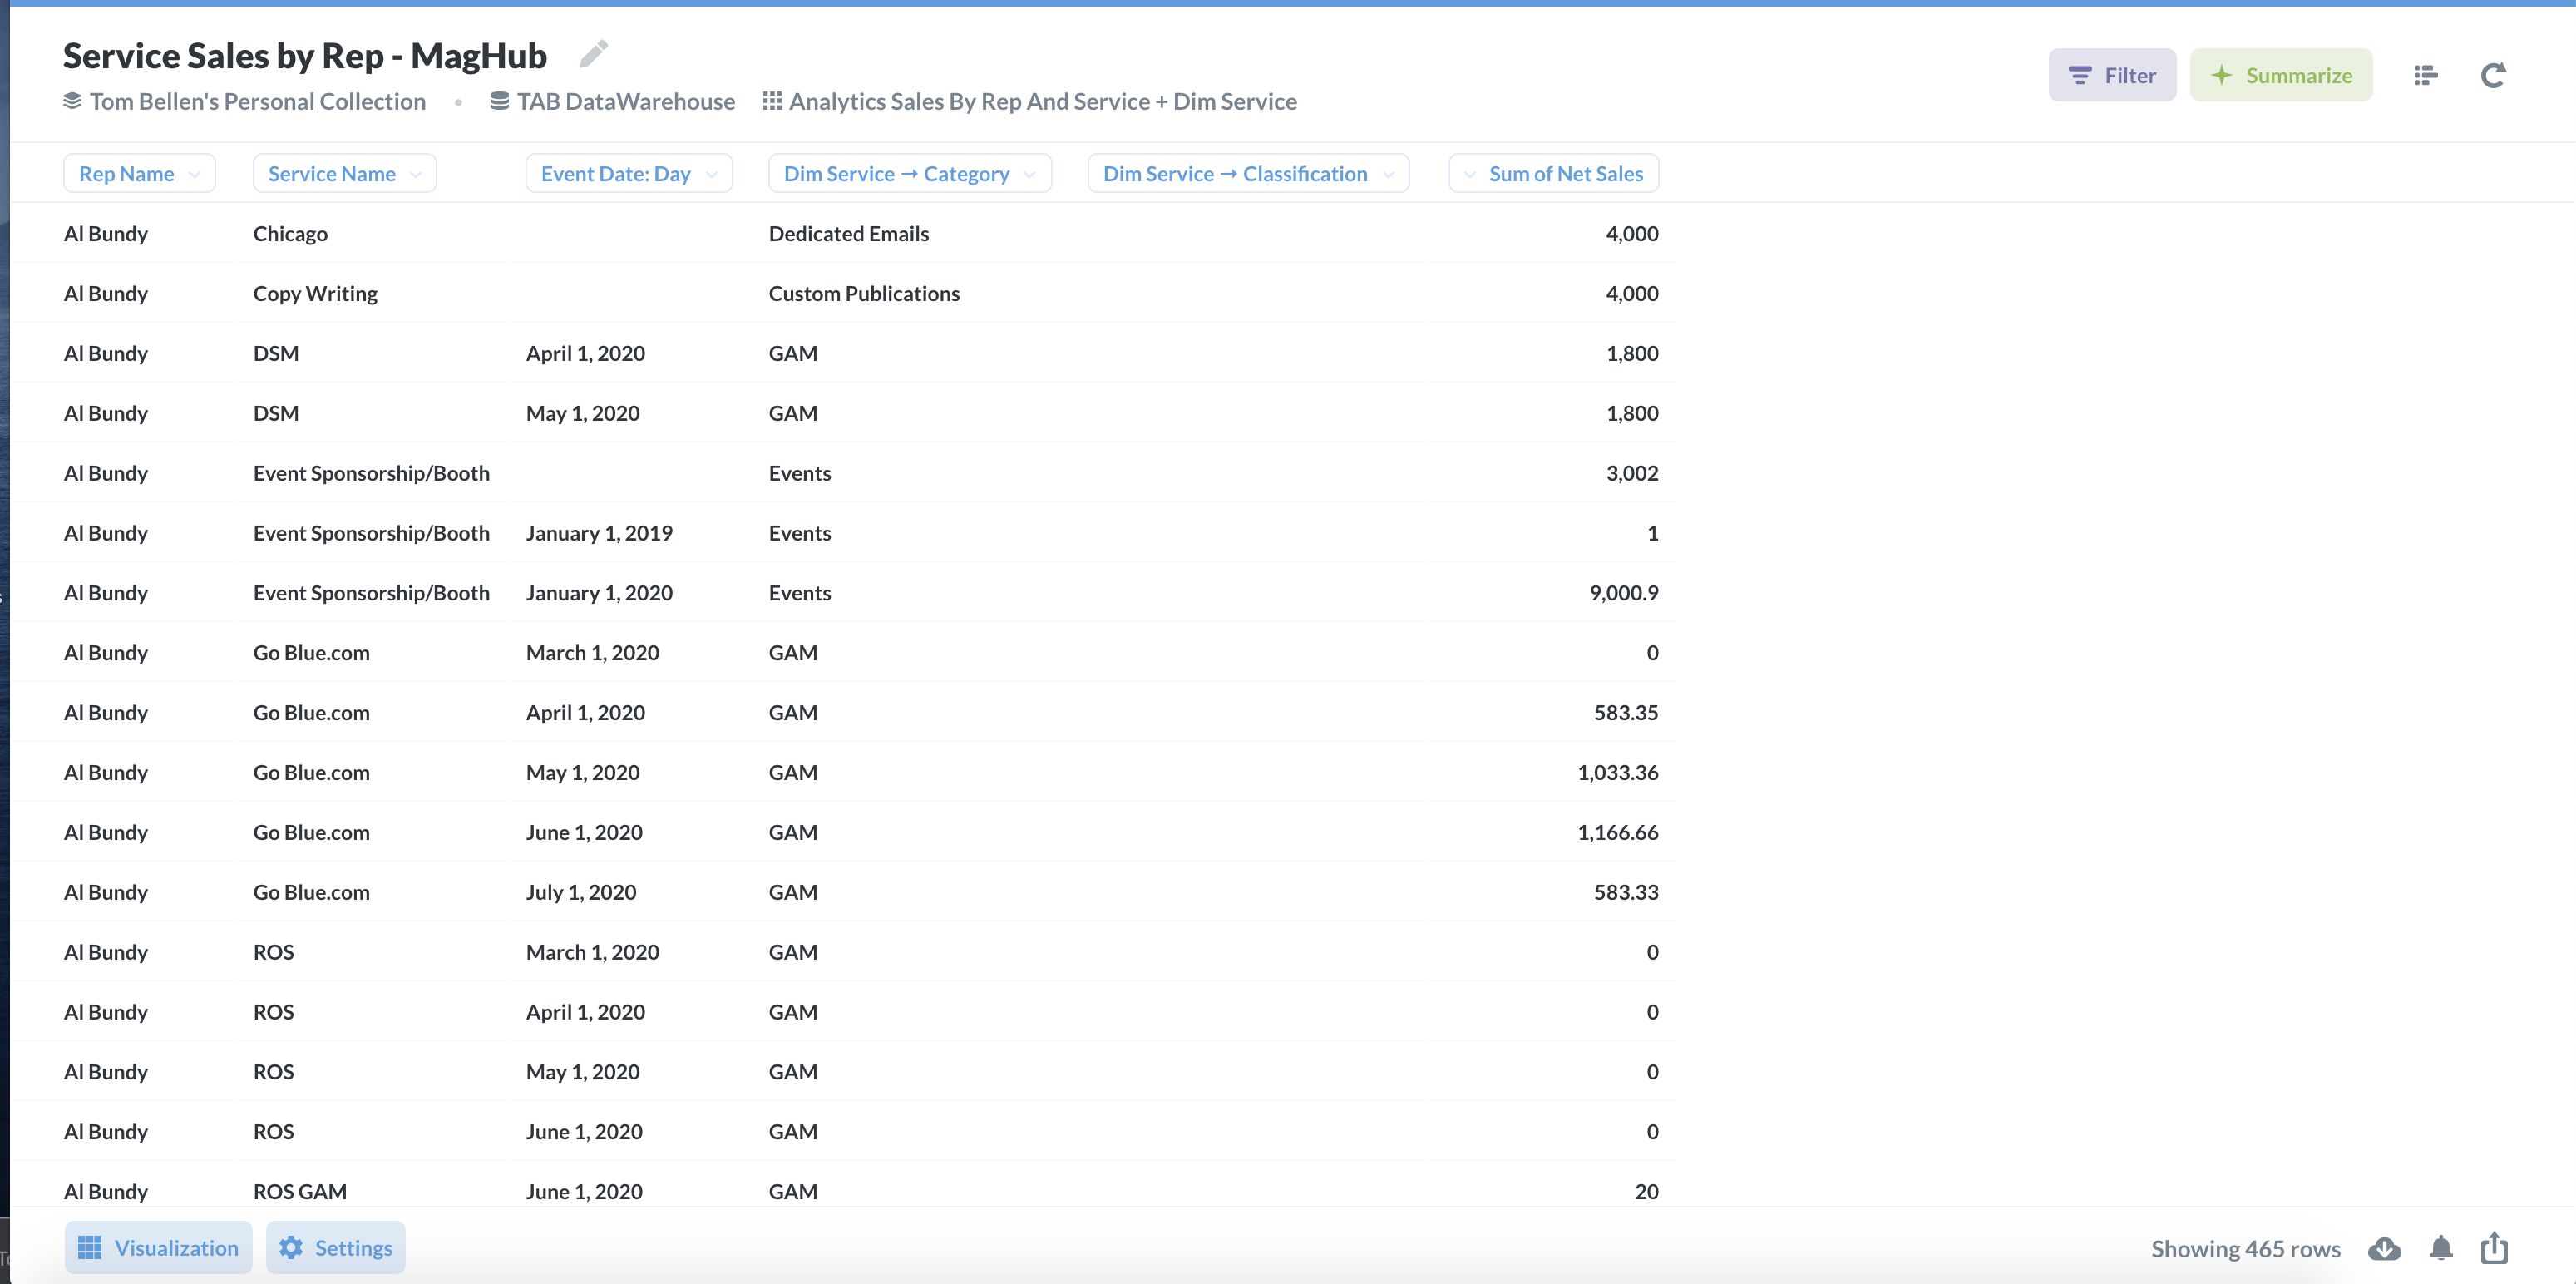
I then changed my Analytics Sales by Rep and Service to display very similar data to my Analytics Sales by Rep and Issue. However, I do want to see the event date and the service name. I also want to see more details about the actual service. For this table, I am going to join it with the Dim Services table and line them up with the Service ID column. Then, I summarized by sum of net sales and sorted by all of the columns I wanted to see.
Now, if I return to my sales dashboard, I will see newly configured data that I am able to filter and interact with.
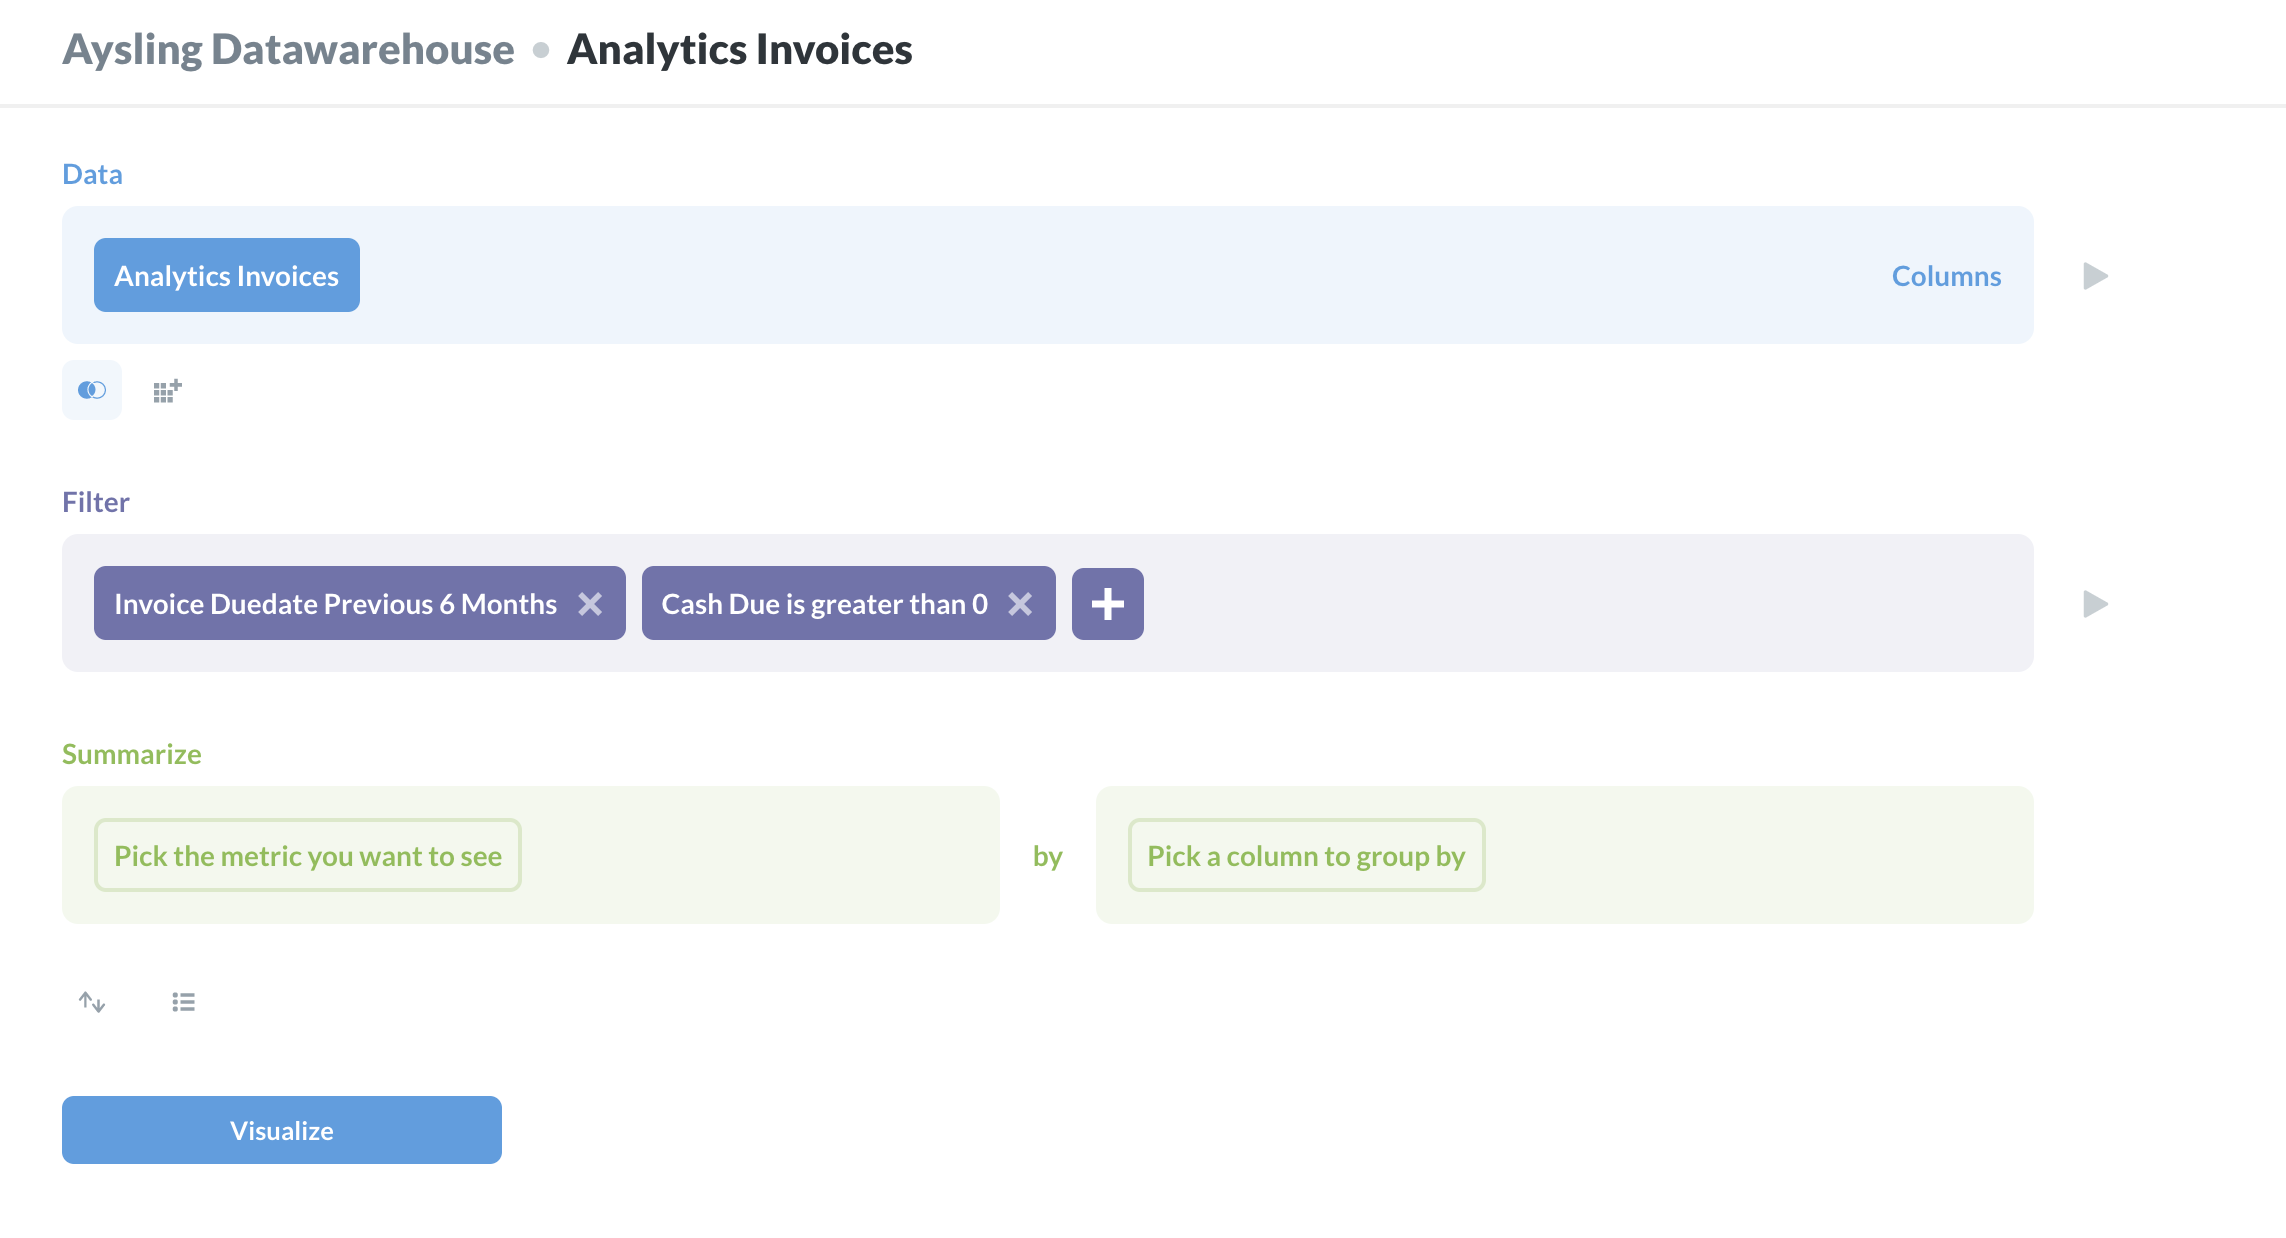
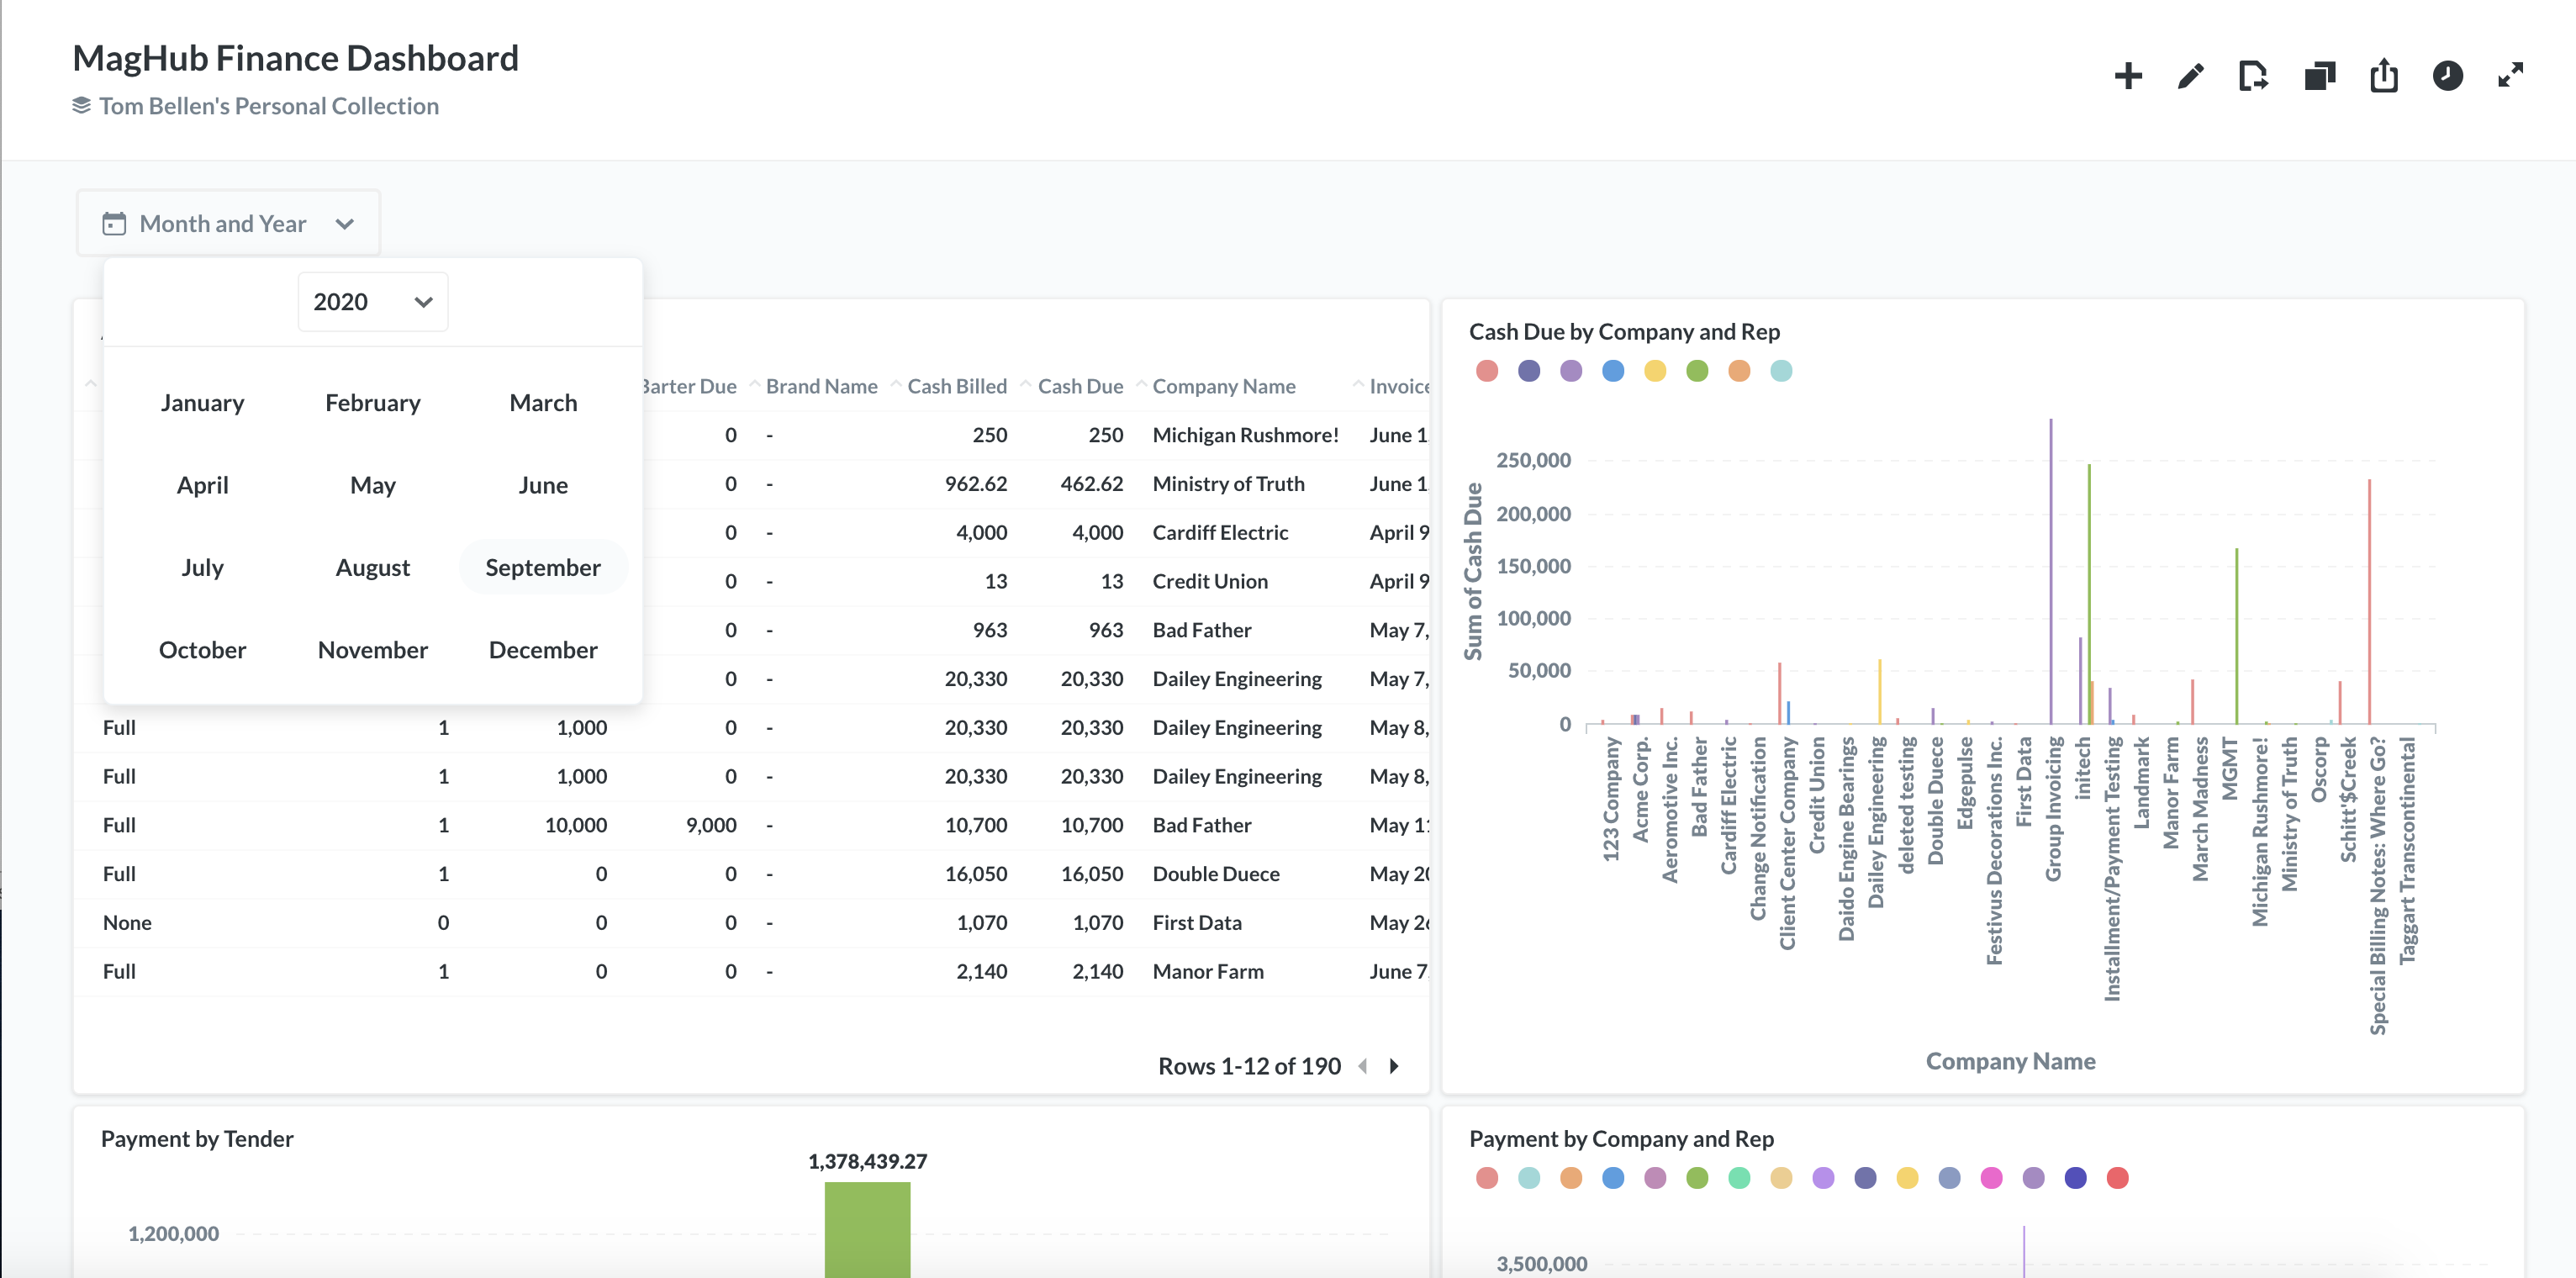
One of the most important things for a company is ensuring that payments are being made on time. You can configure Metabase tables to show you which invoices are unpaid with due dates that have passed. Then, you can embed these tables into your system dashboard so you can see the information on a daily basis. I created a new dashboard in Metabase to add this data to.
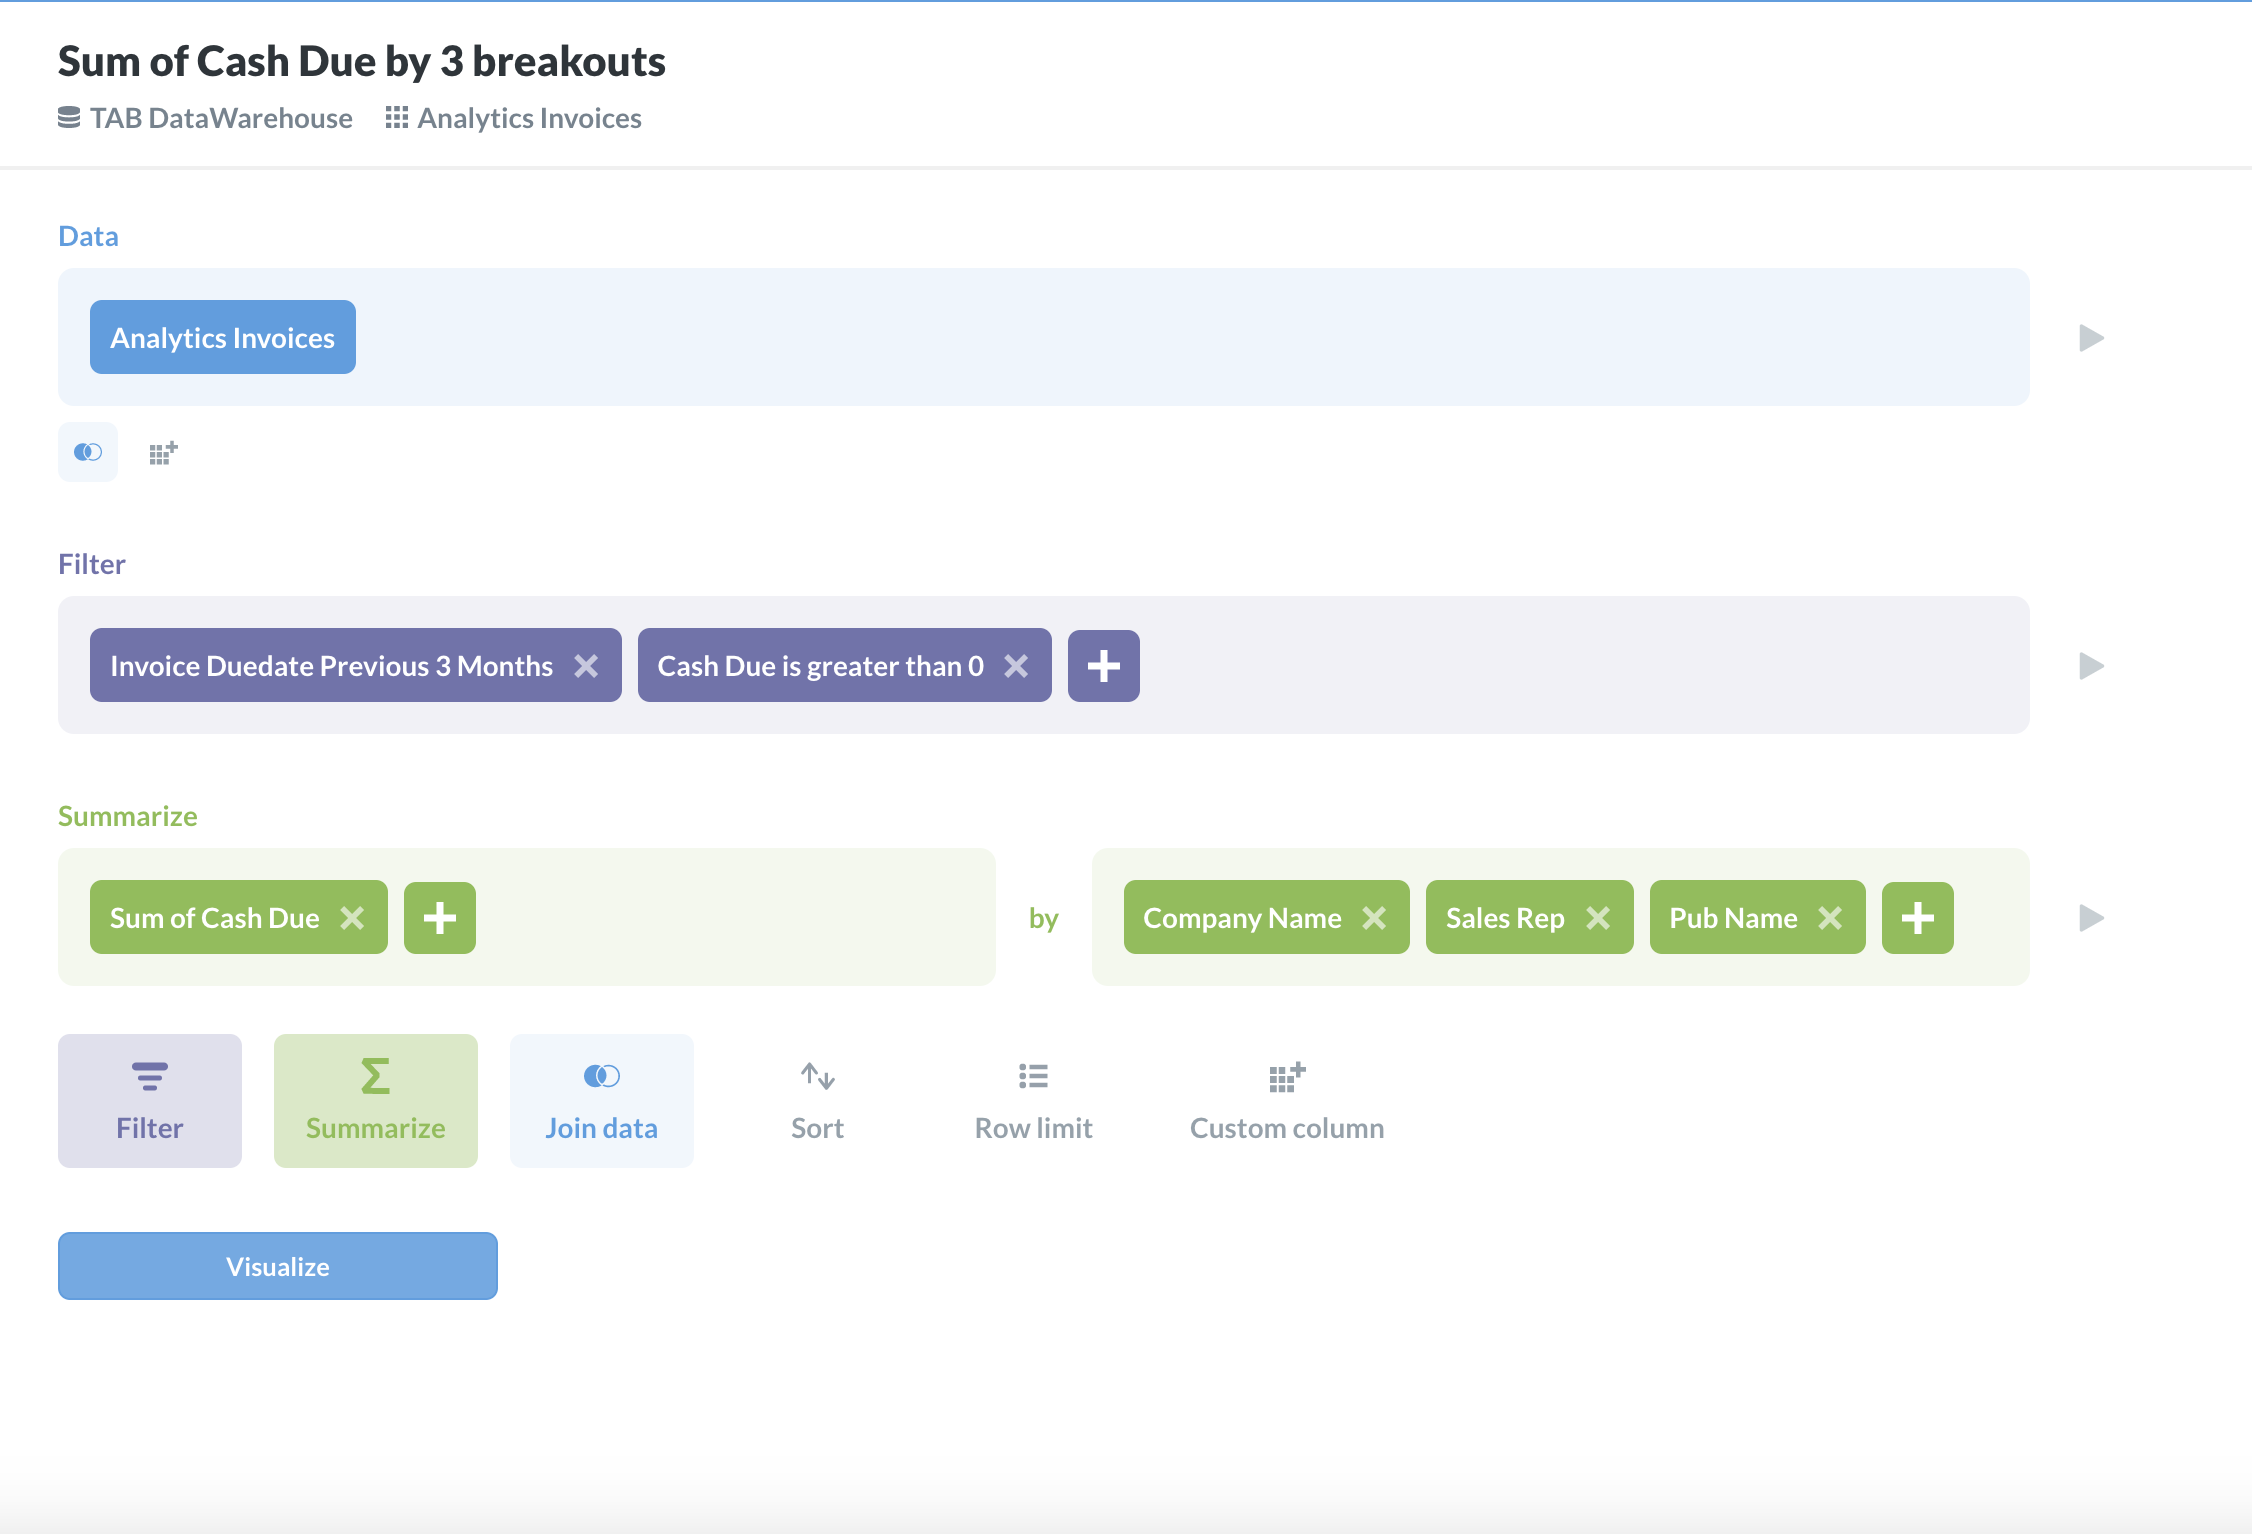
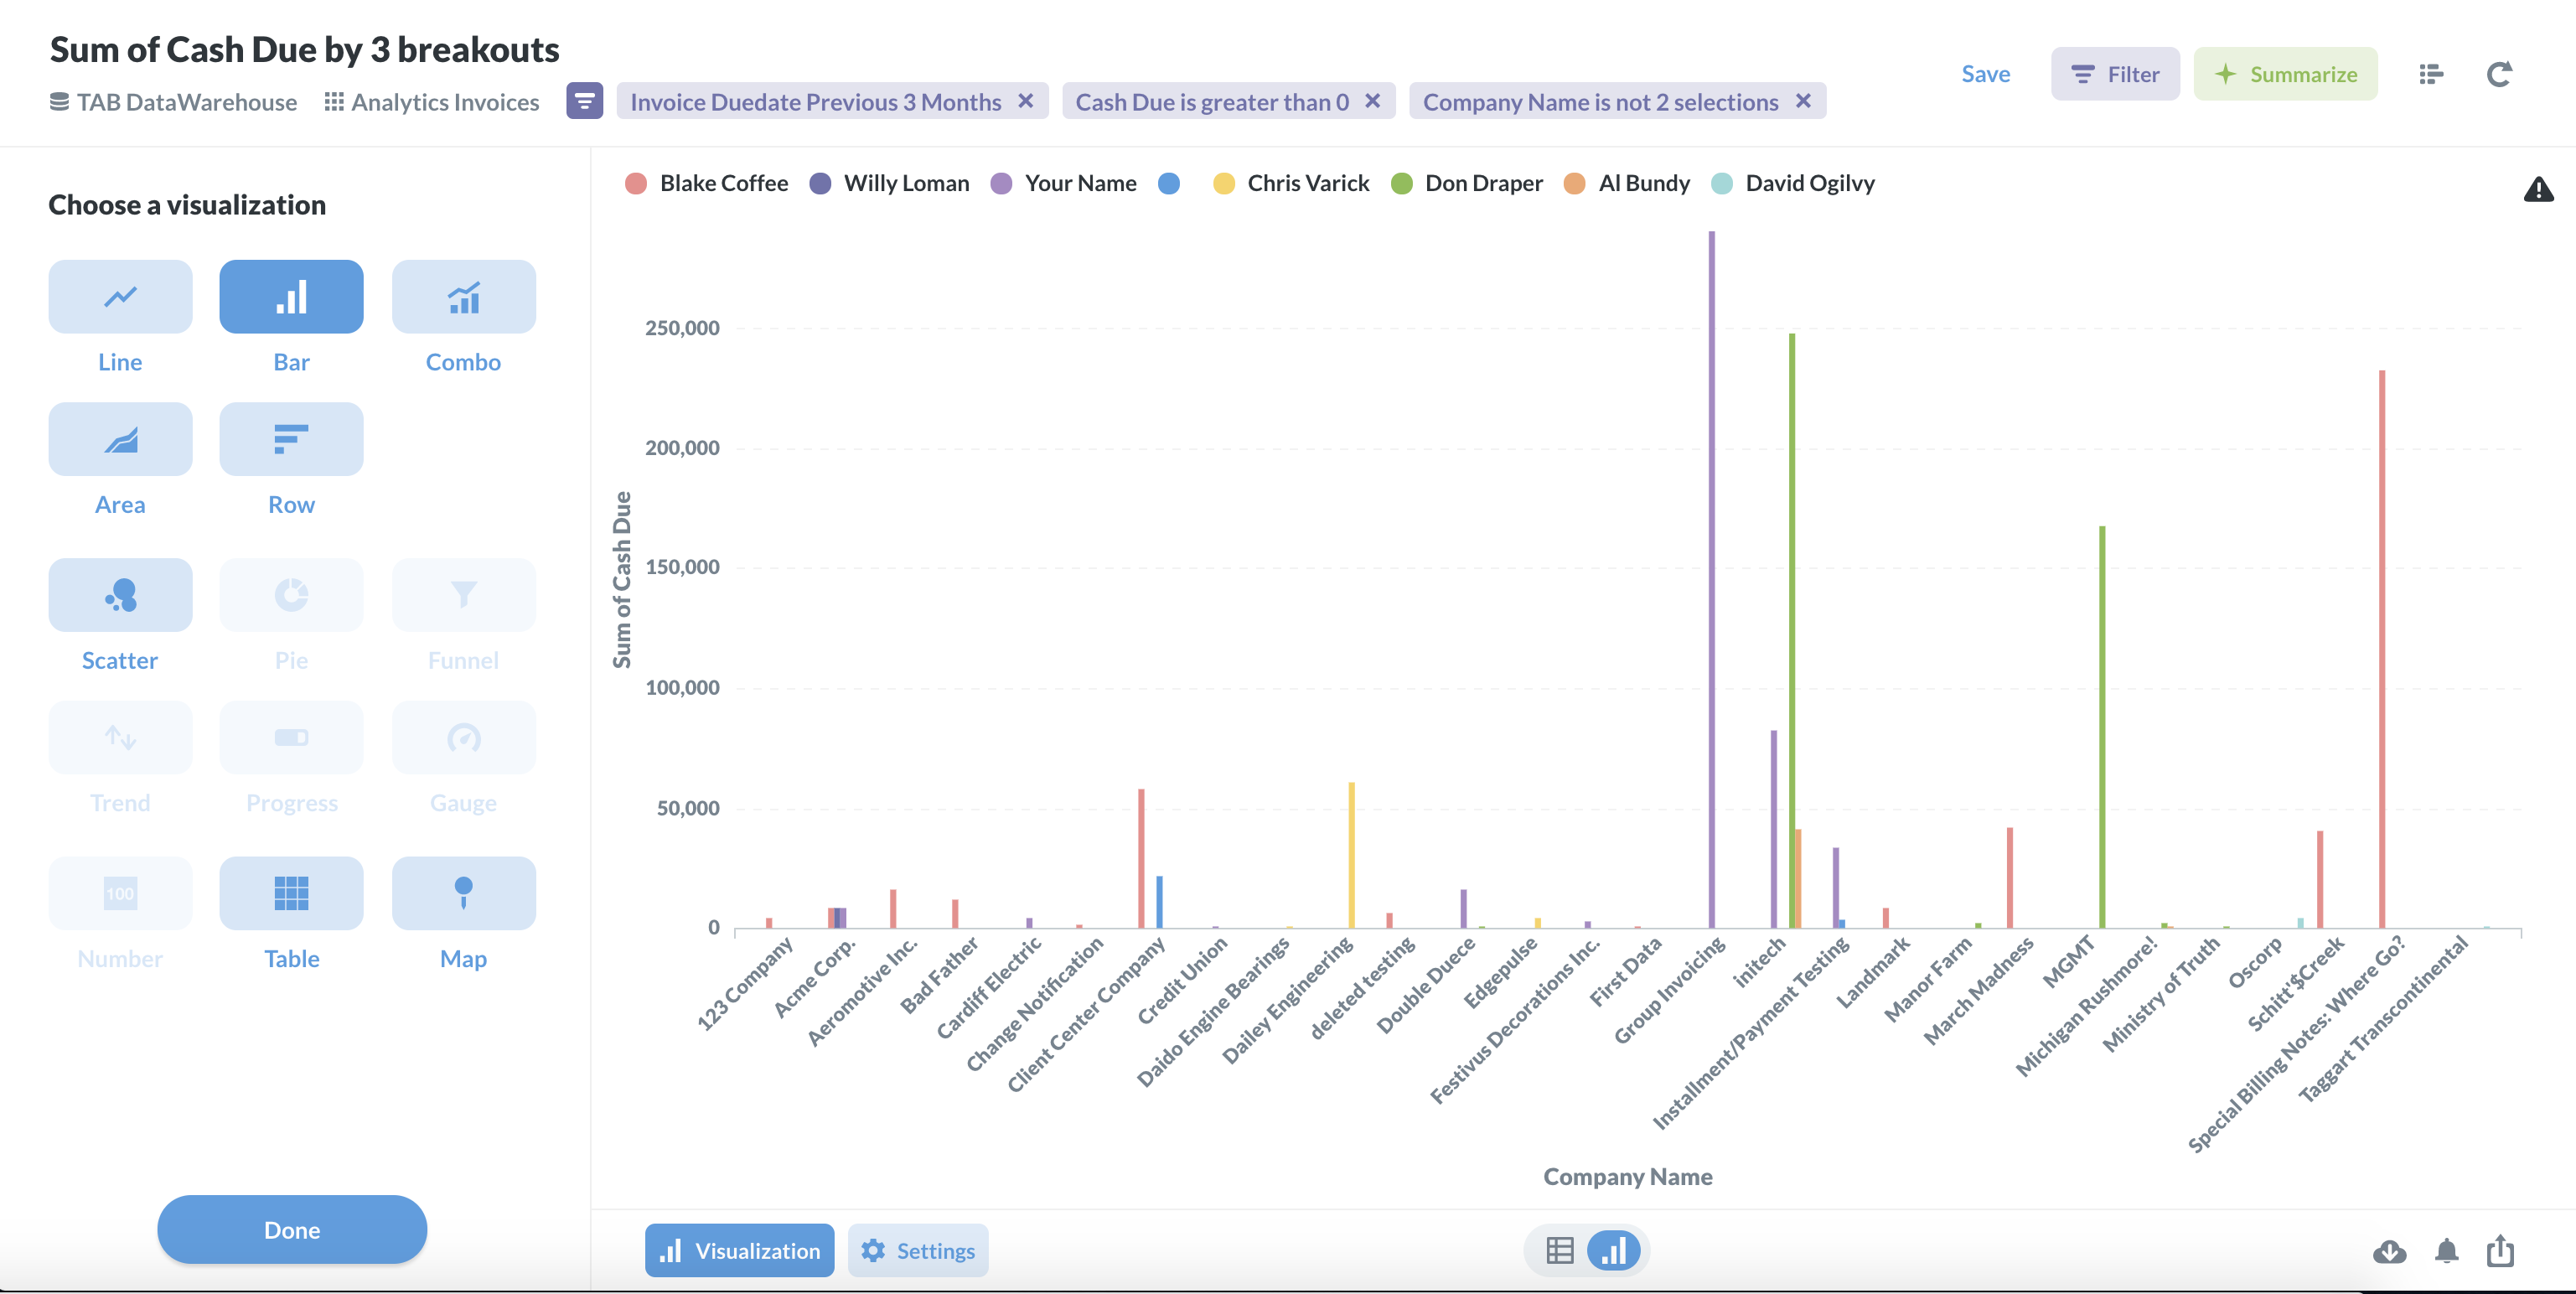
First, I started with the Analytics Invoices table. Then, I added two filters so I would only see balances that have been unpaid. I chose to filter by invoice due dates from the previous 6 months and cash due is greater than 0. Then, I chose visualization and got rid of all of the columns in the table that were not important to me.
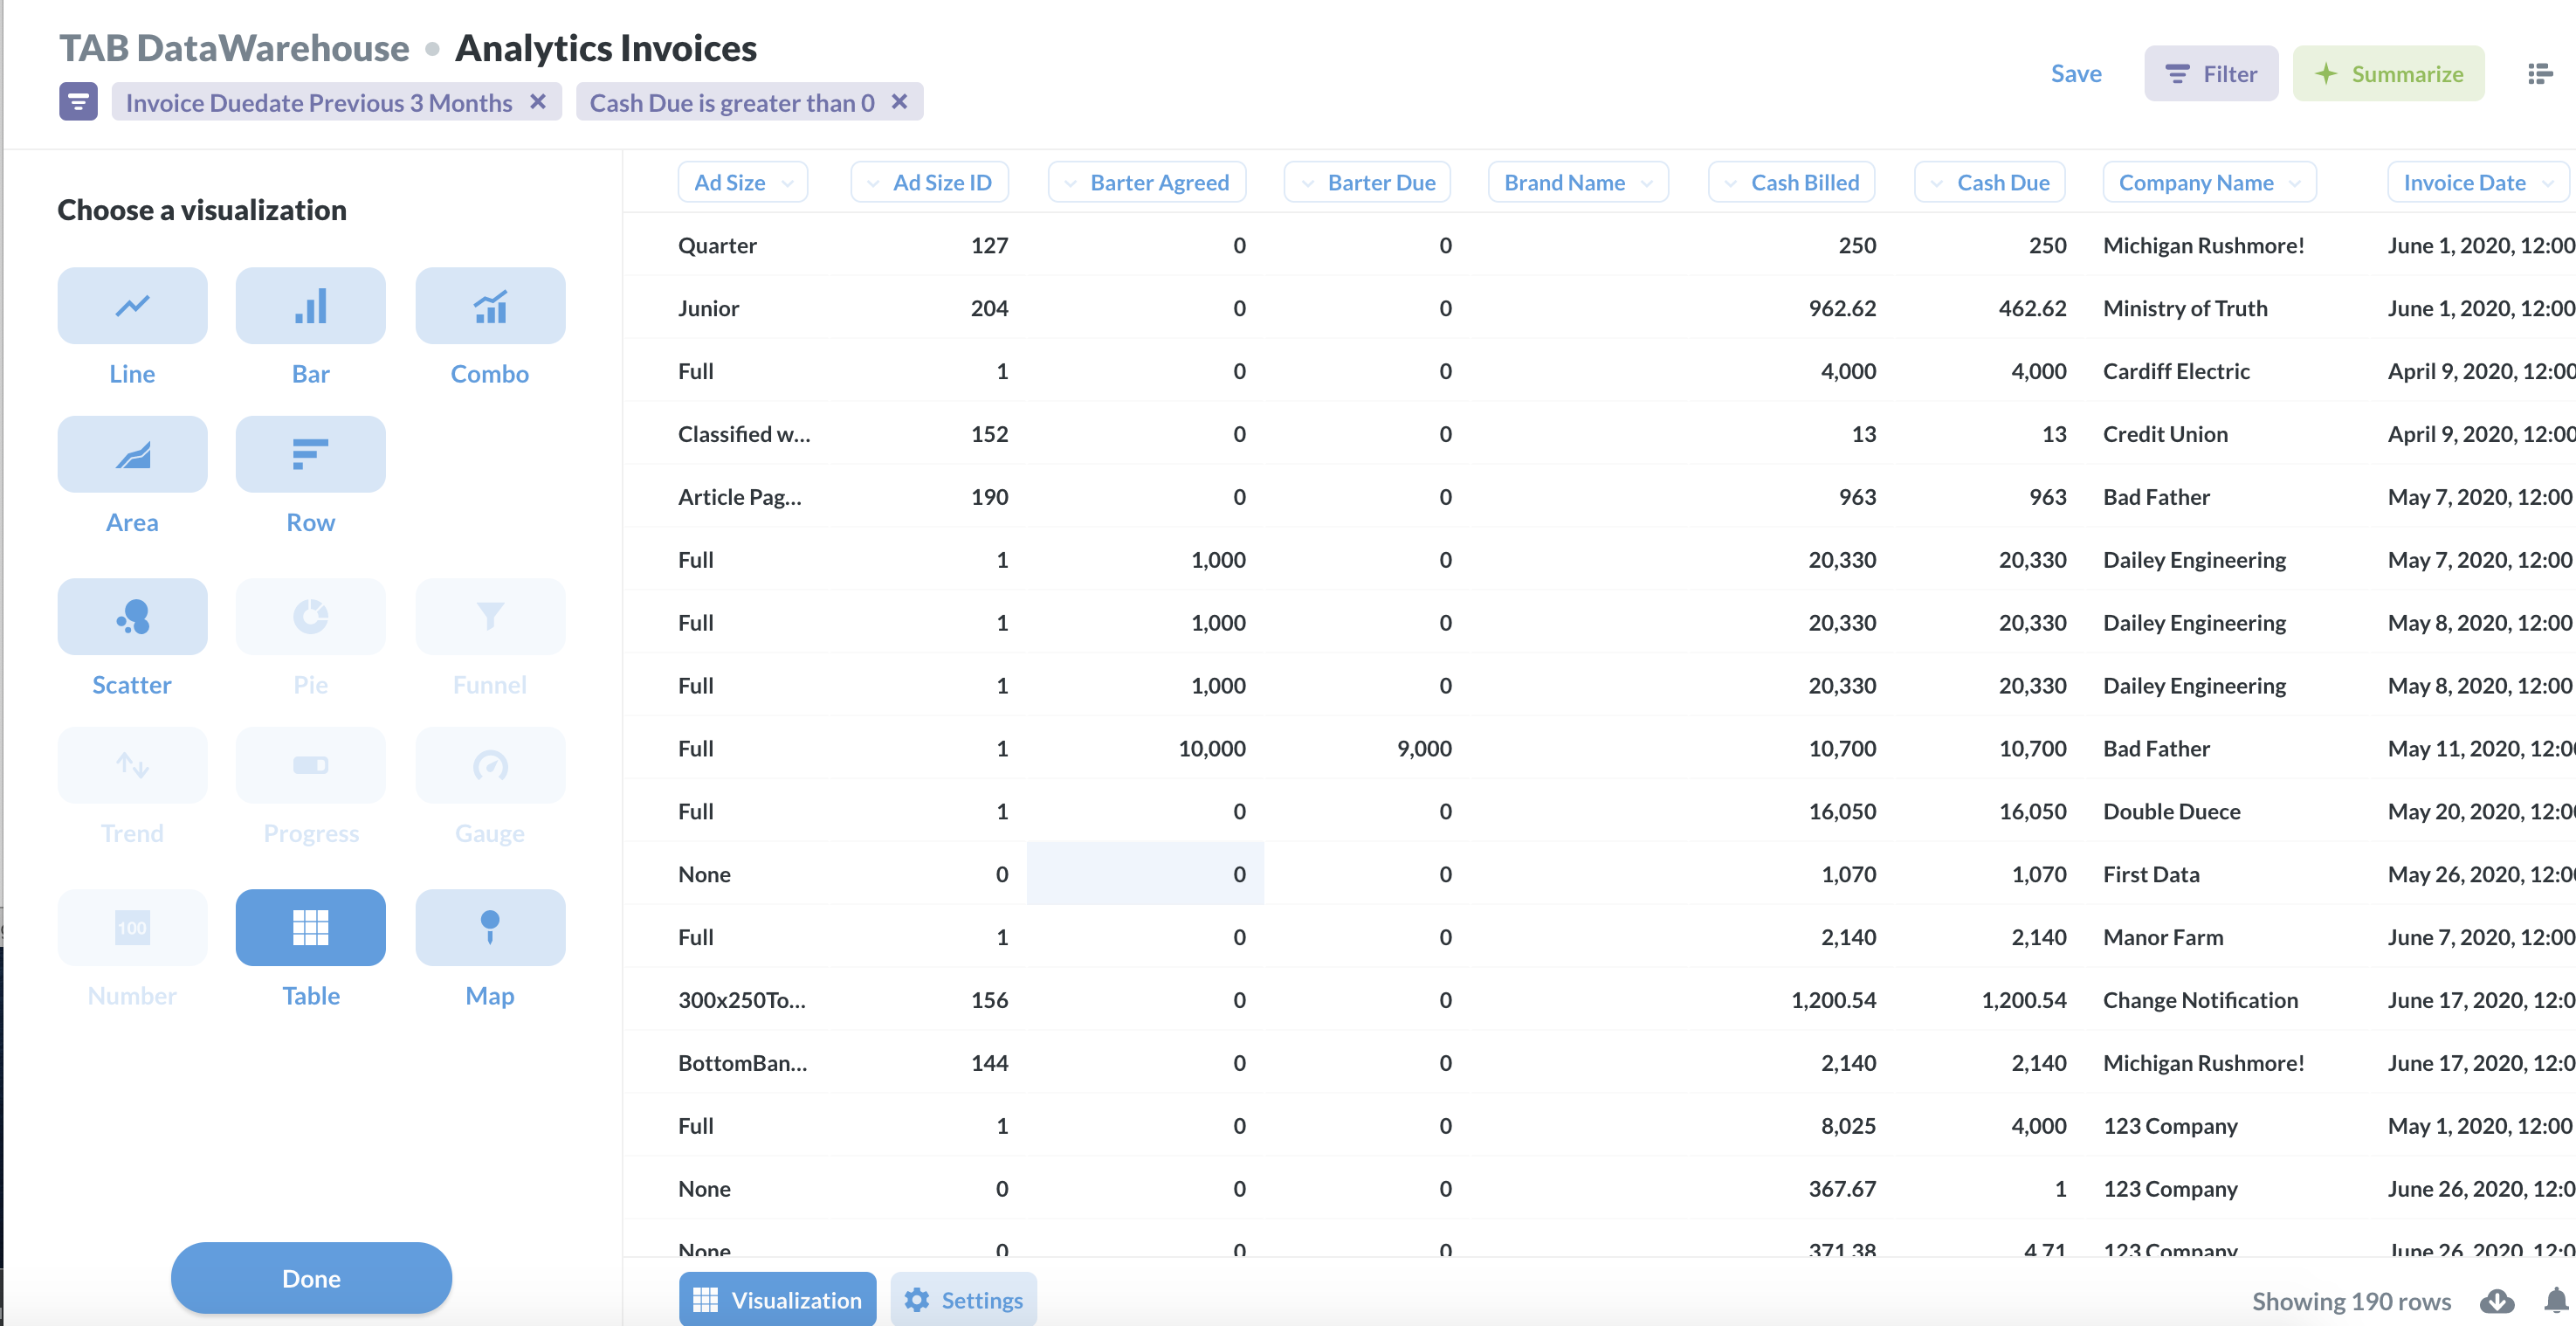
This gave me a snapshot of any outstanding invoices, but I also wanted to see more detailed information about the invoice and the payment. I added another table starting with Analytics Invoices. This table I summarized by sum of cash billed, and I grouped the results by all of the columns of information that I wanted to see about my invoices.
I then created an almost identical table but starting with Analytics Payments instead. This time, I summarized by sum of payments and grouped the results by very similar options to my Analytics Invoices table.
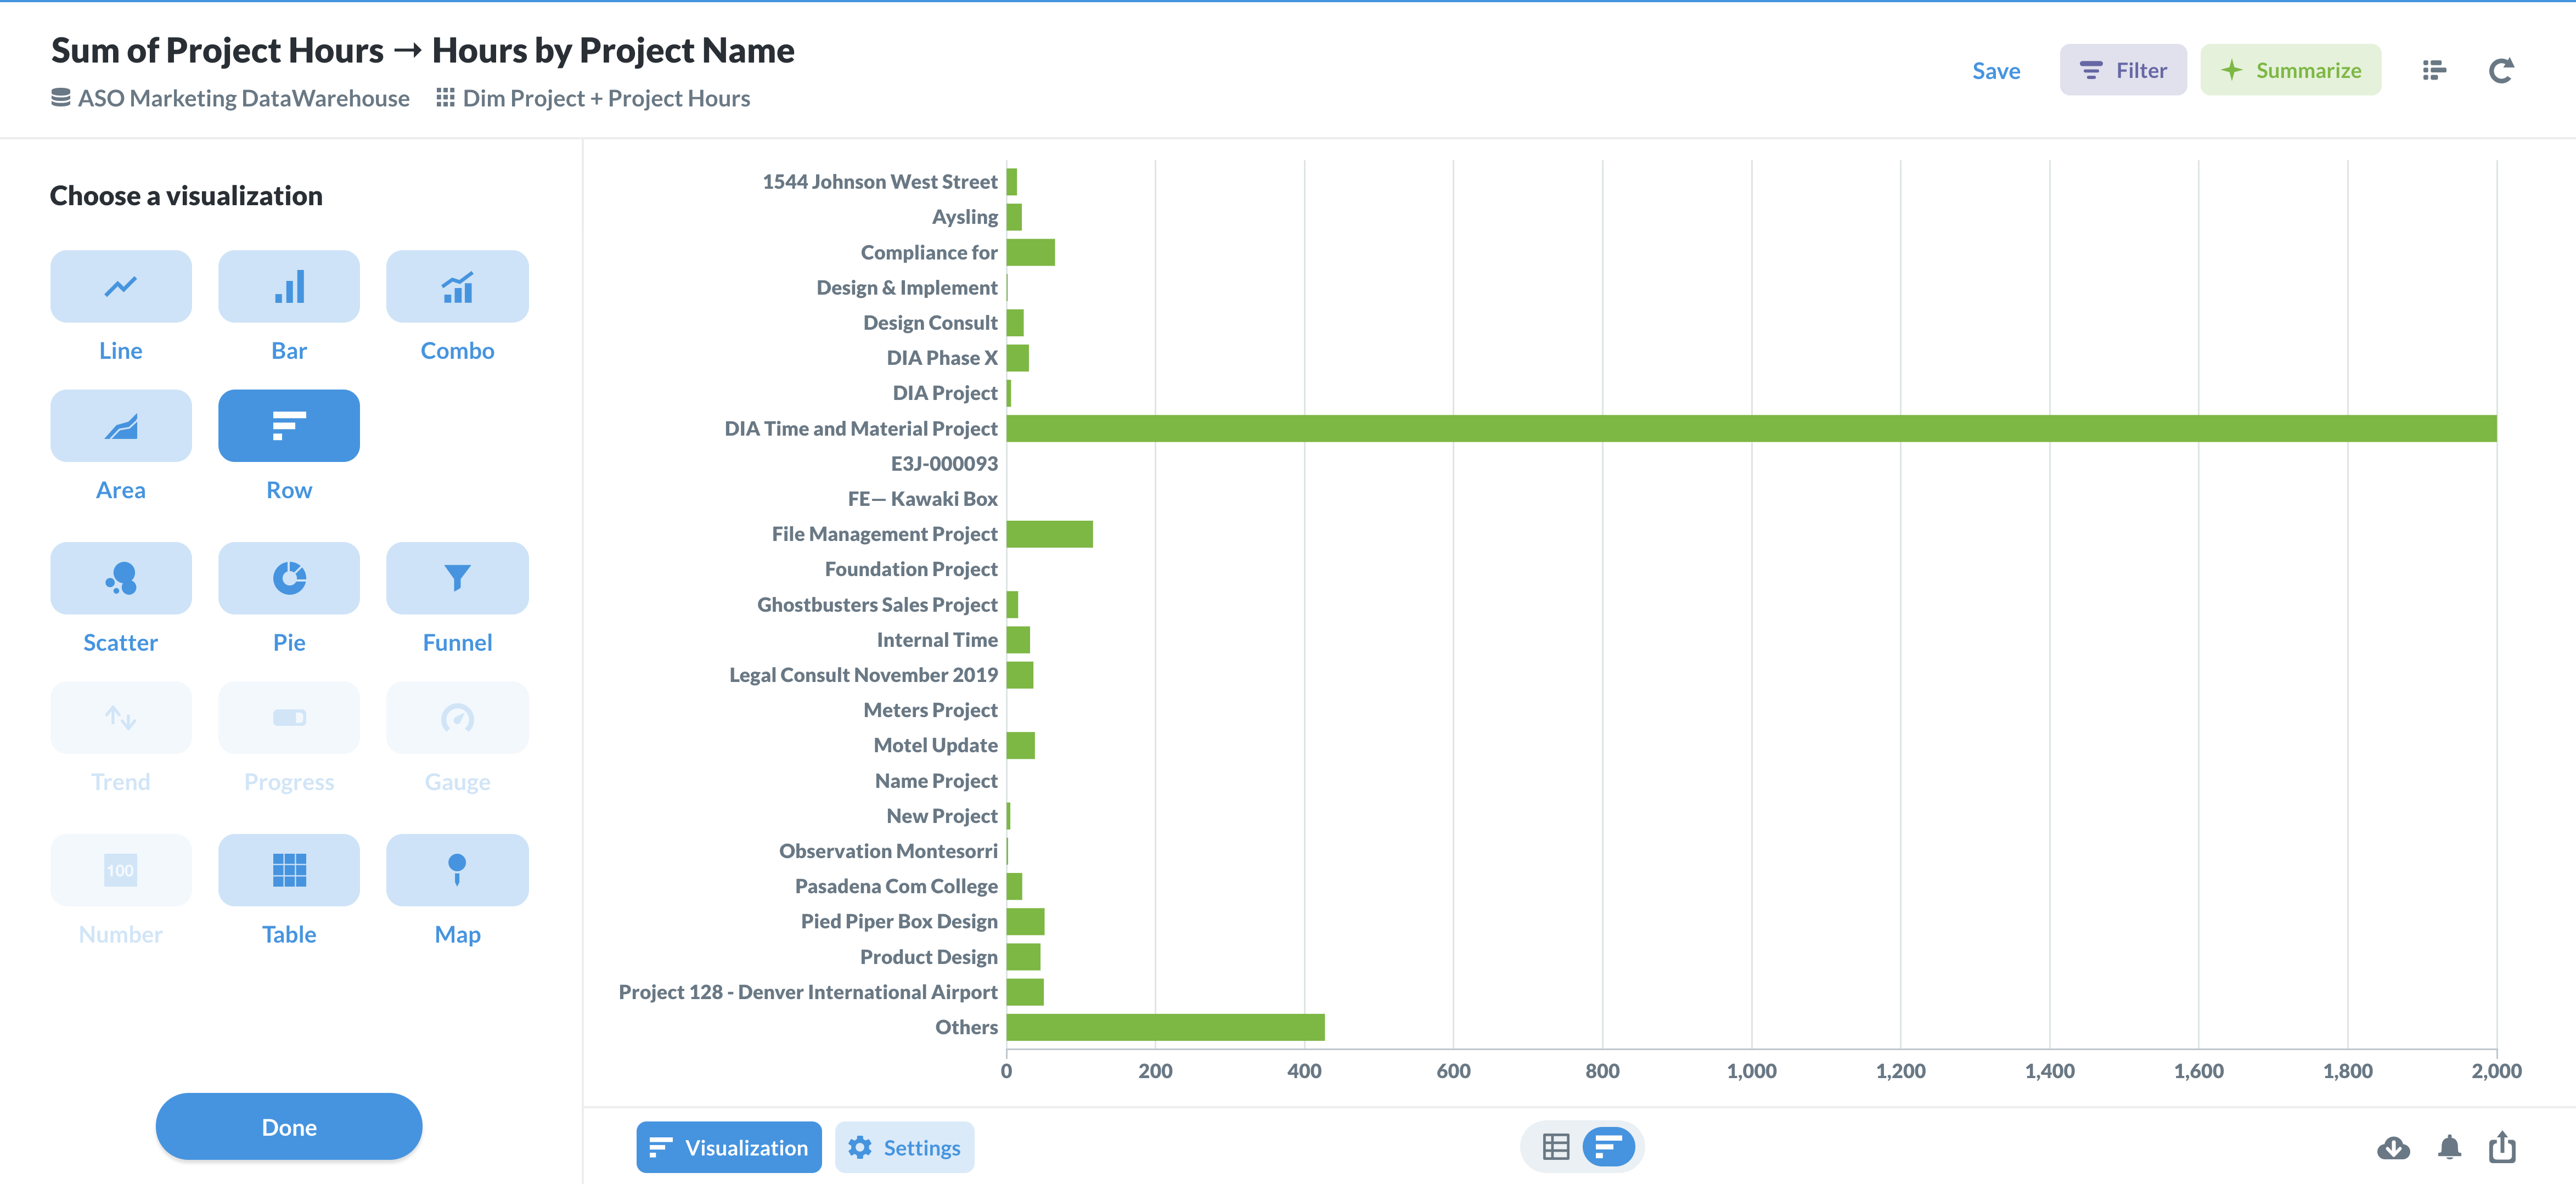
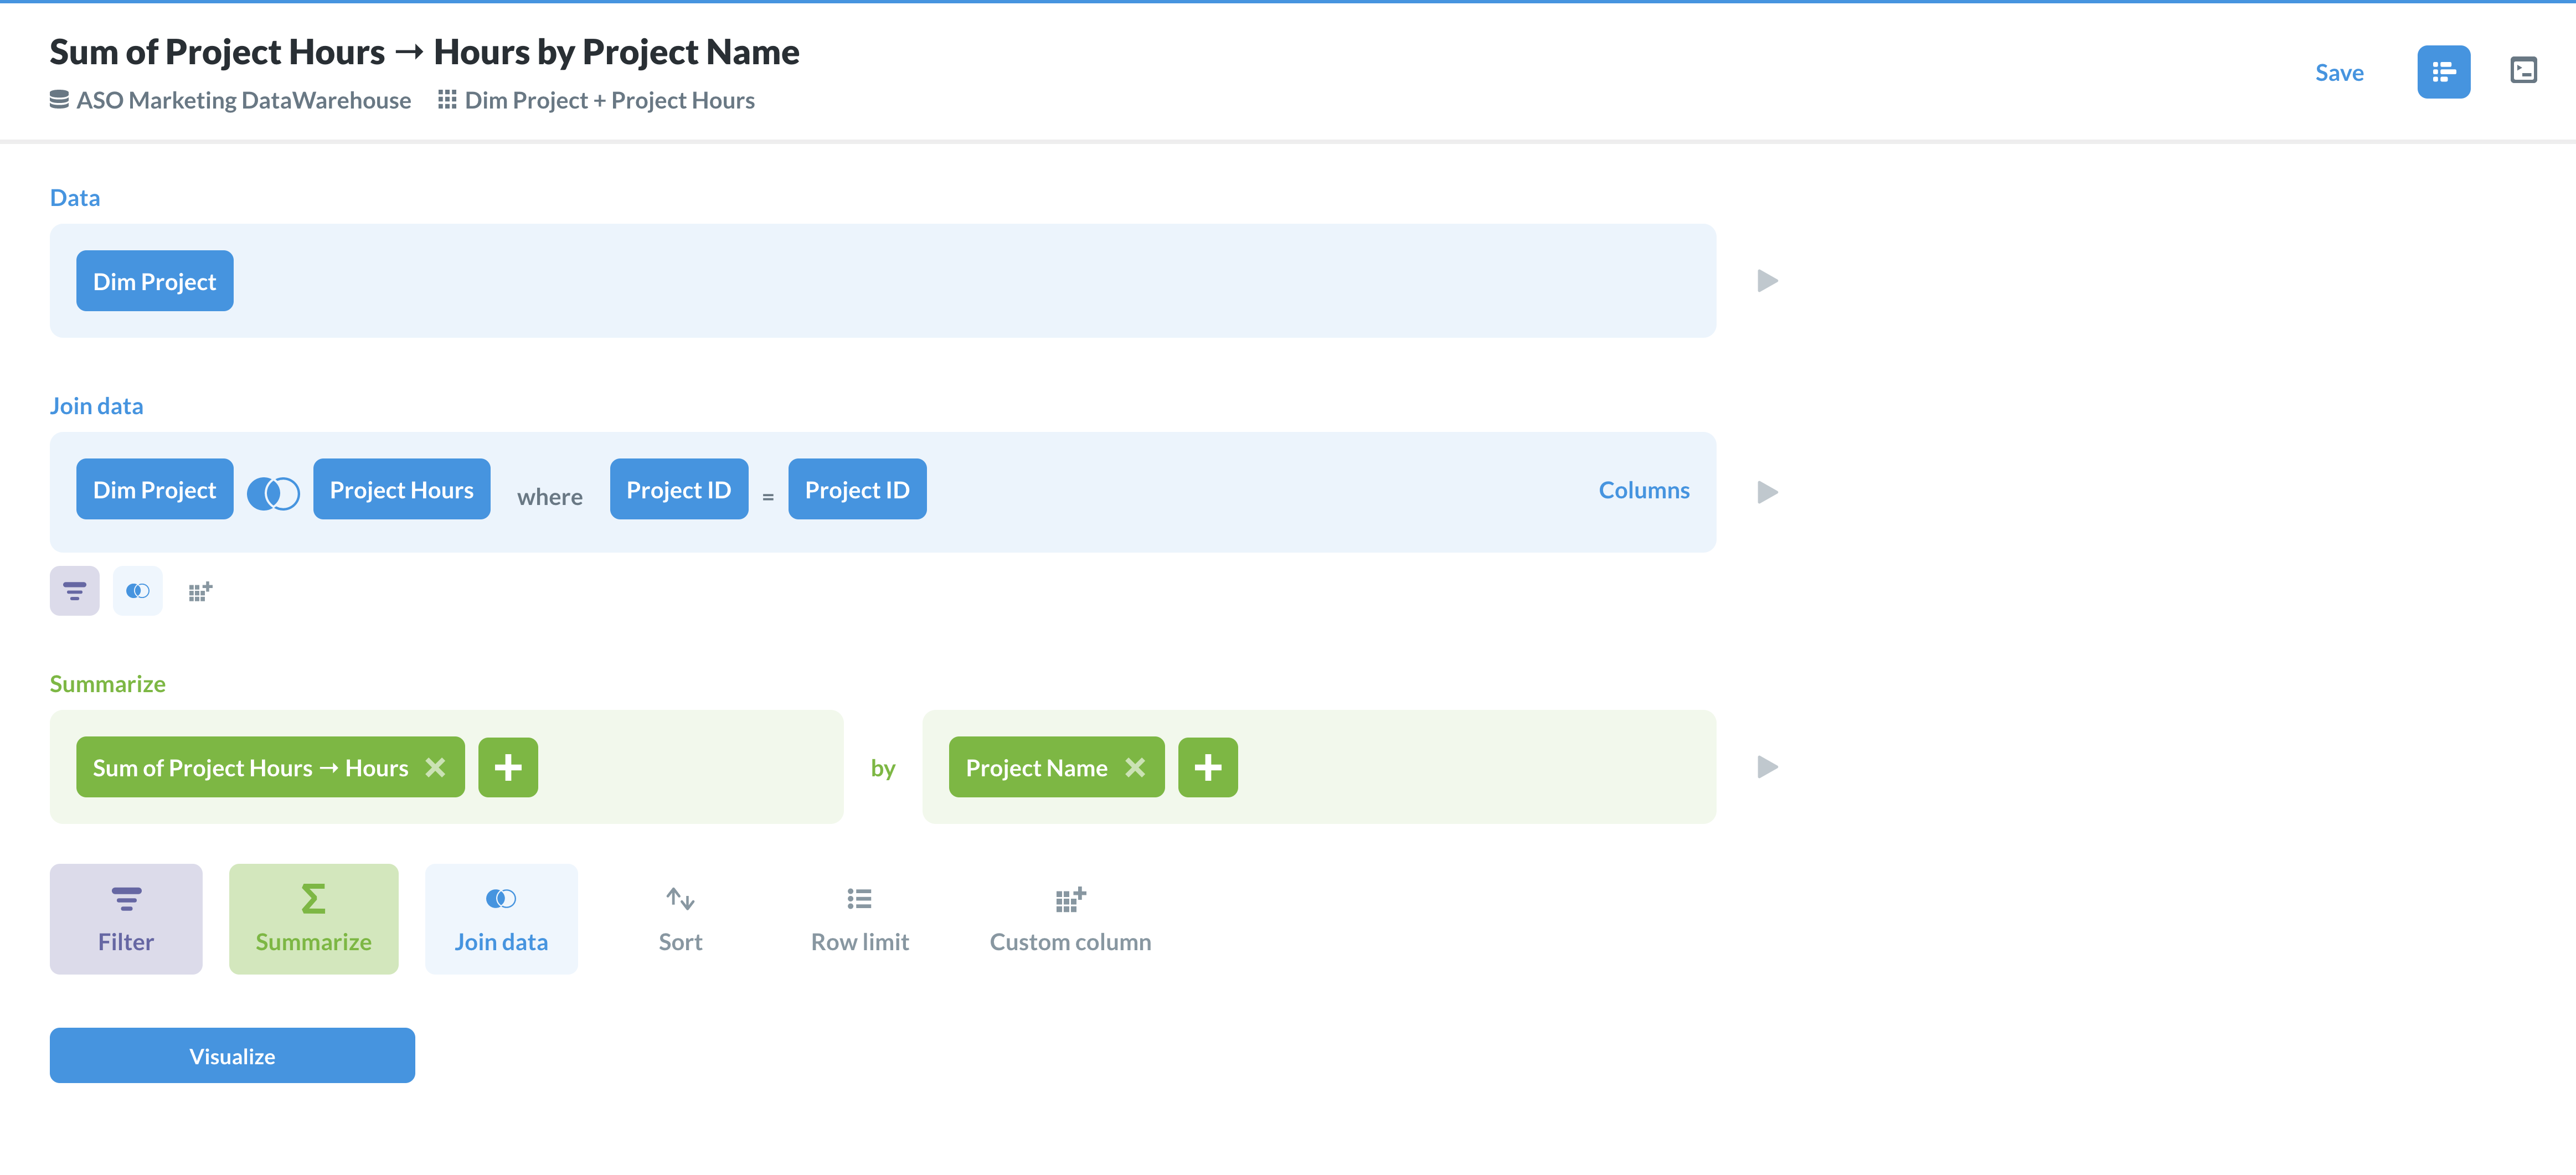
As a project manager, I want to keep an eye on the hours that are worked for each project, based on the project, the milestones, and the tasks. I created a new dashboard to house these project tables in, and I created pie charts so I can see a snapshot of where the hours worked are going to.
I started with the table Dim Project, and combined it with Project Hours. Then, I summarized the data by sum of project hours, grouped by project name. I changed the display to a pie chart, so I can easily view how many hours have gone into each project.
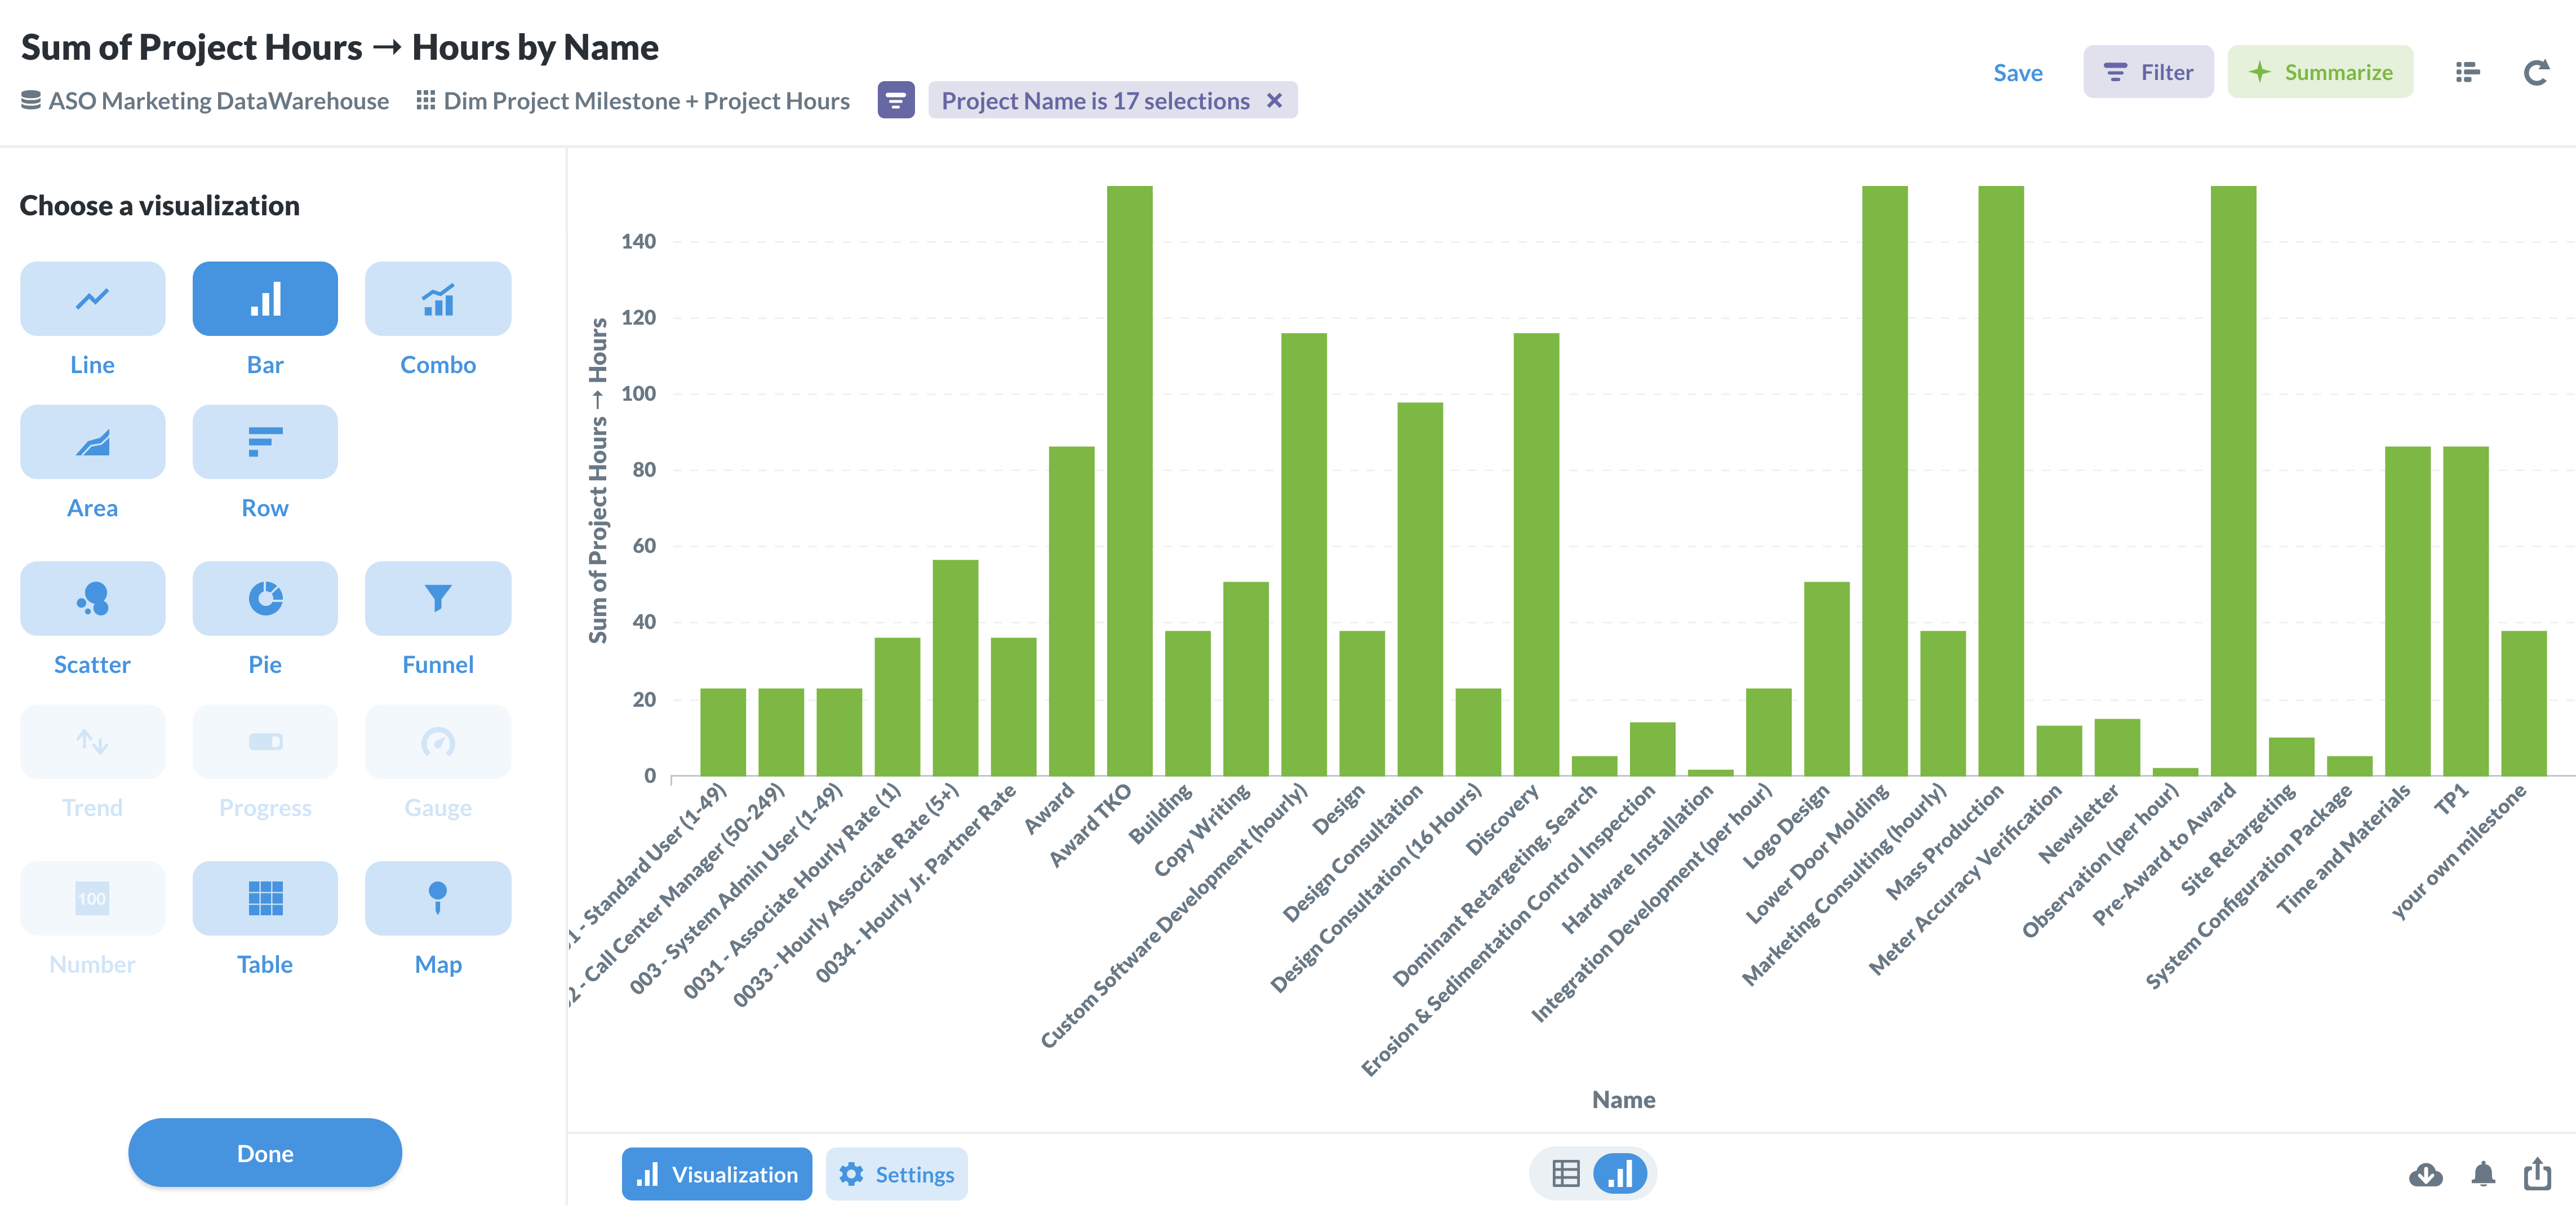
My next table was for my project milestones. I started with the Dim Project Milestone table, and formatted the table in the exact same way as my Dim Project table.
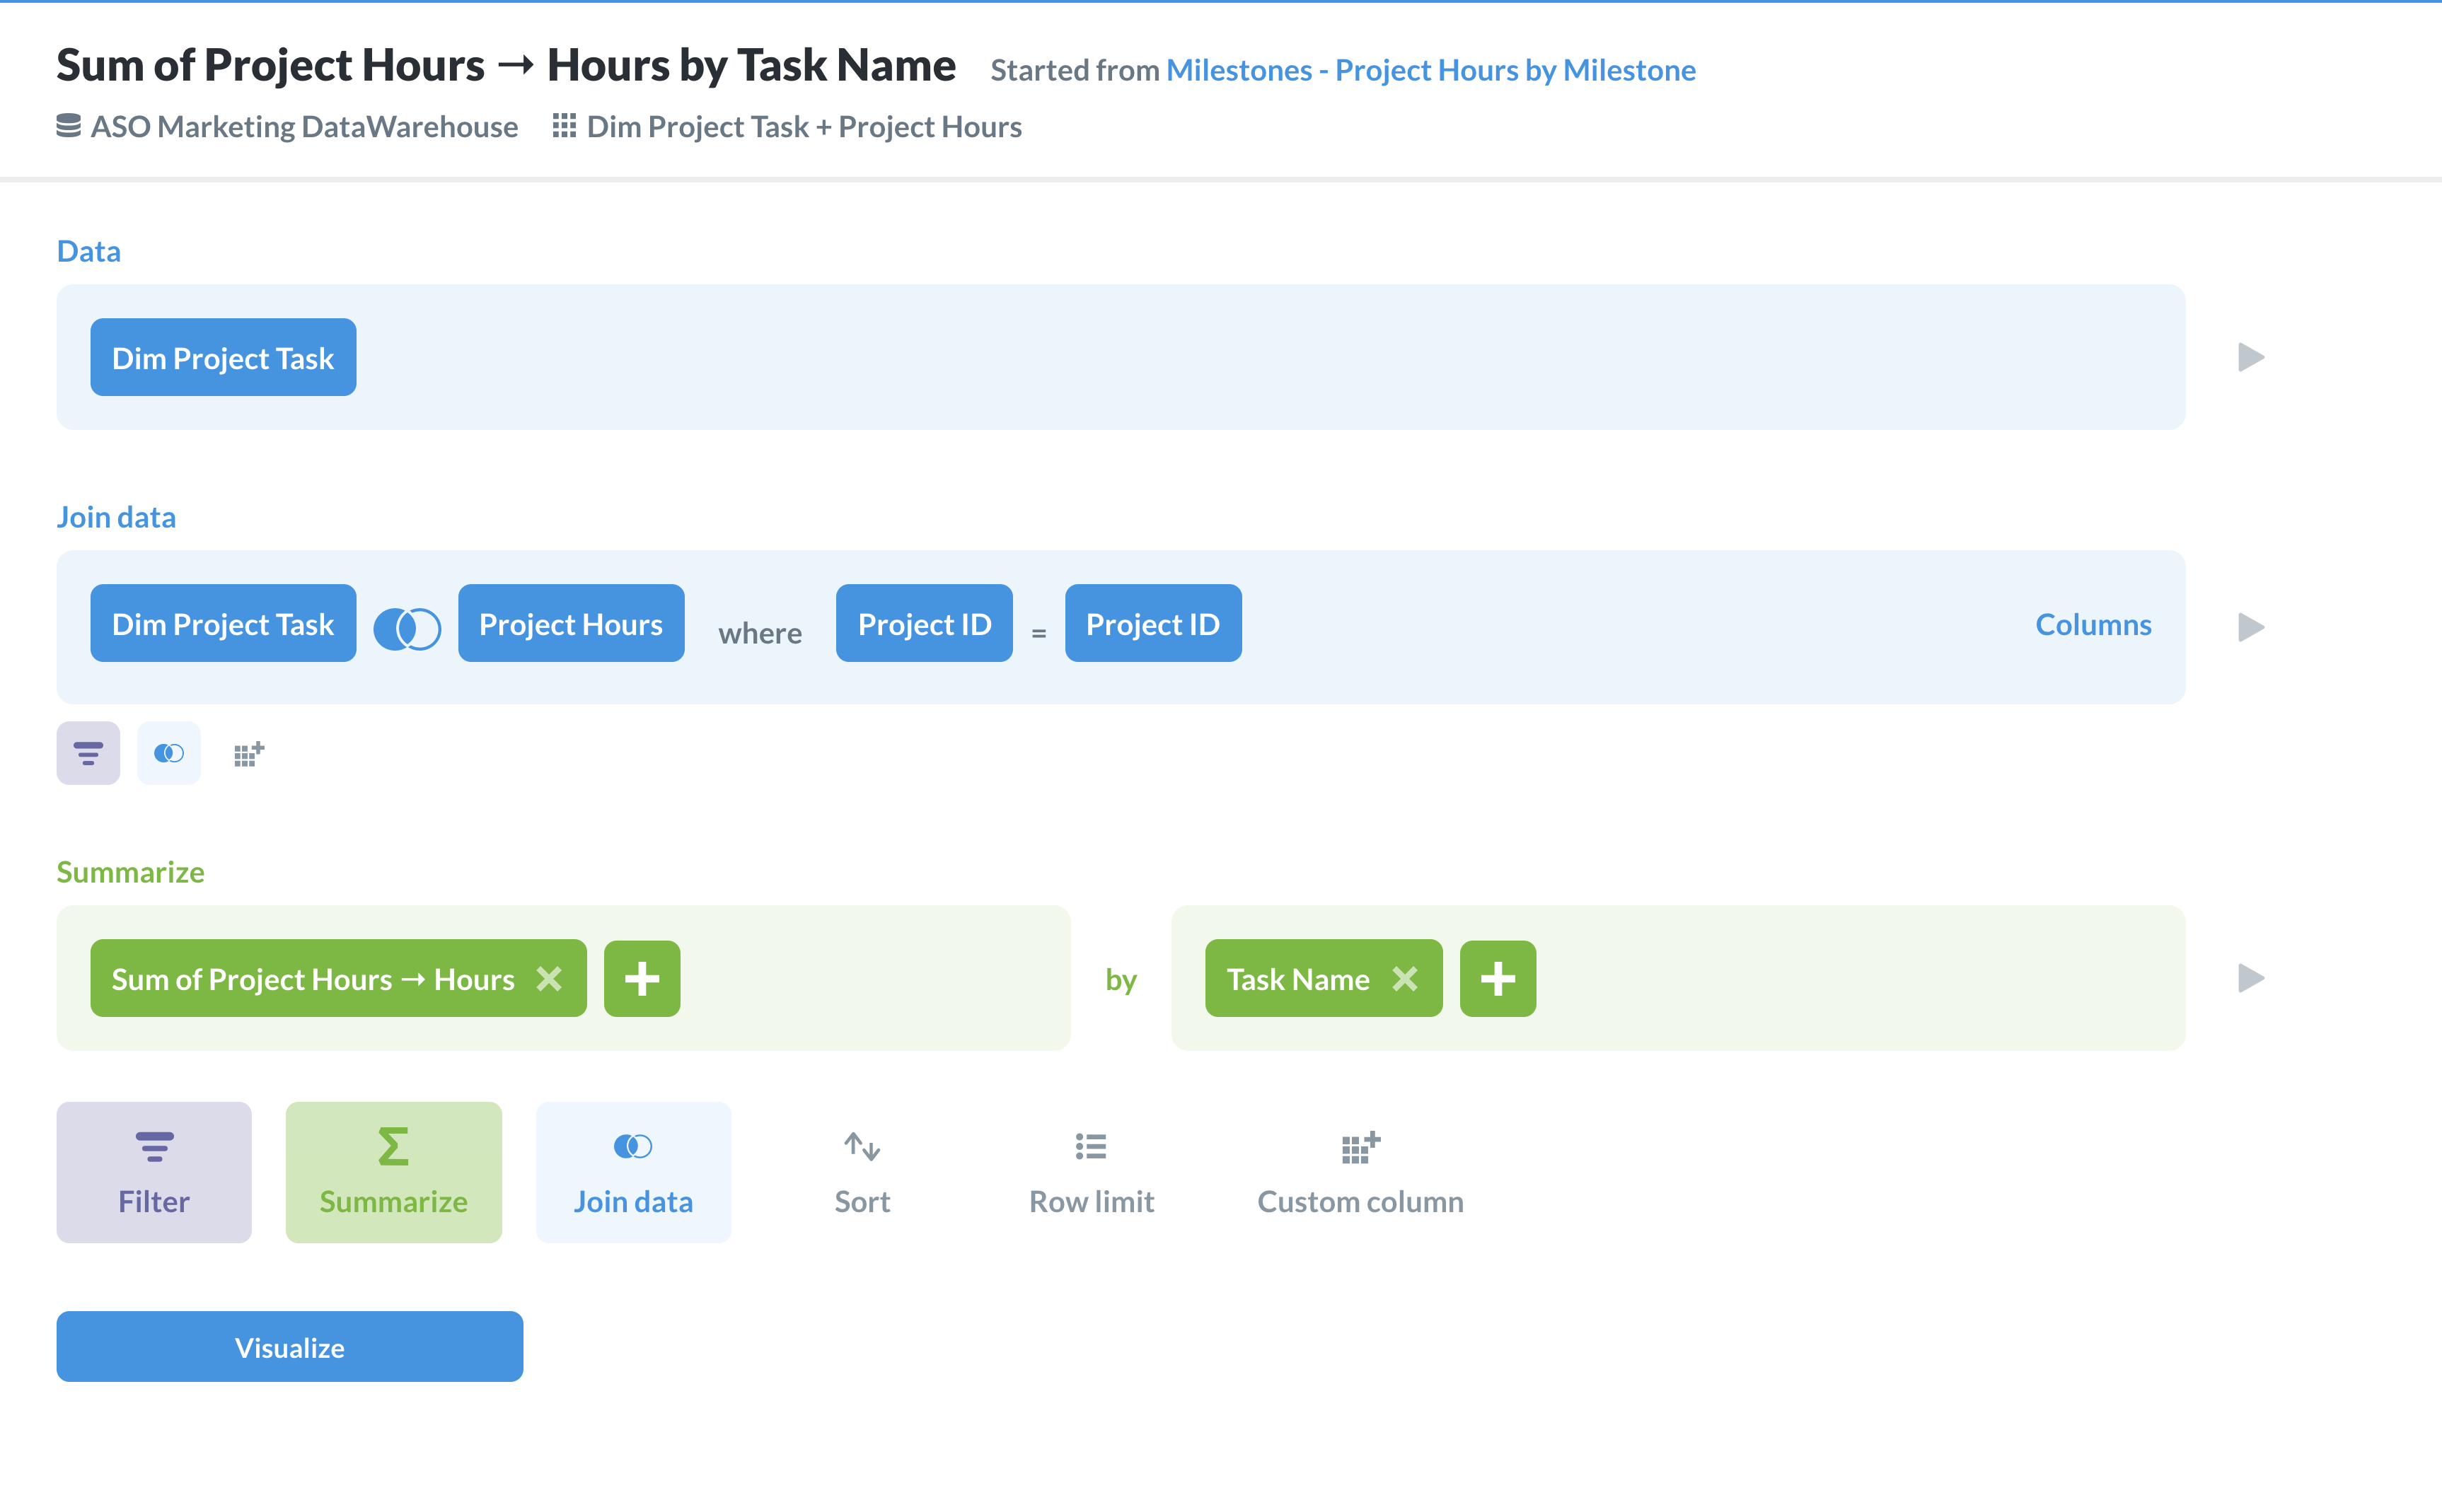
My next table was for my project tasks. I started with the Dim Project Task table, and formatted the table in the exact same way as my Dim Project table.
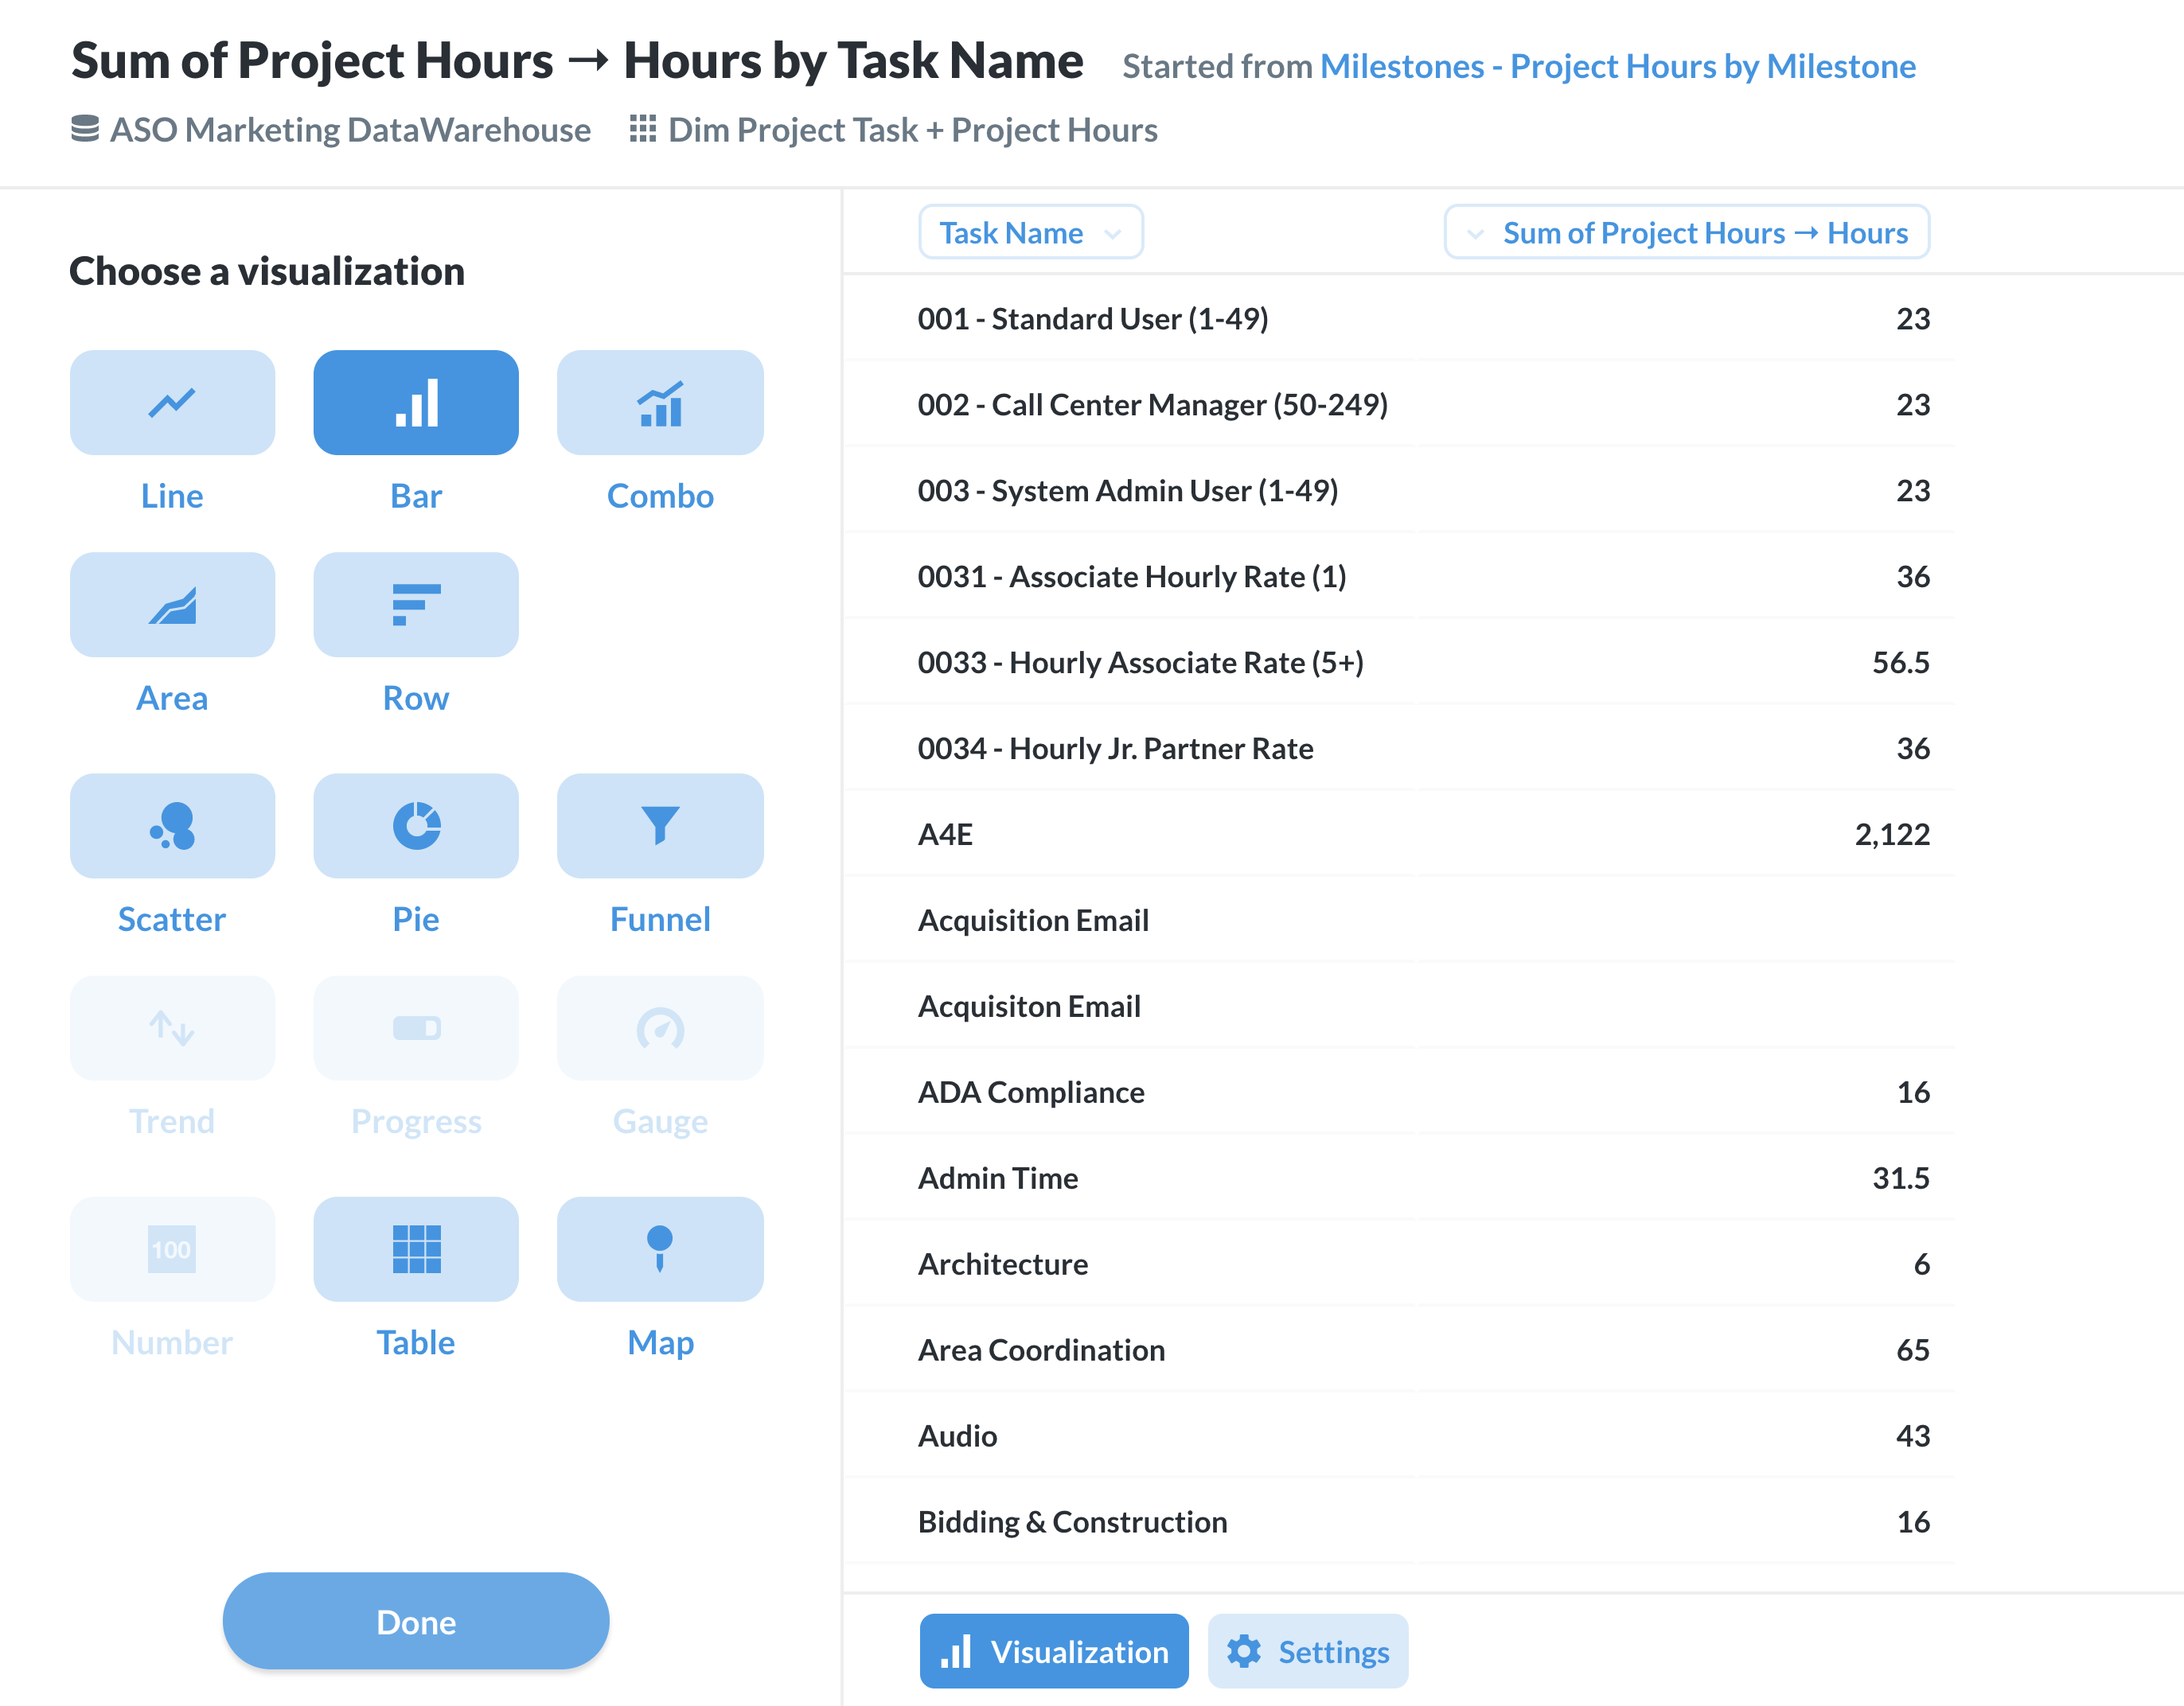
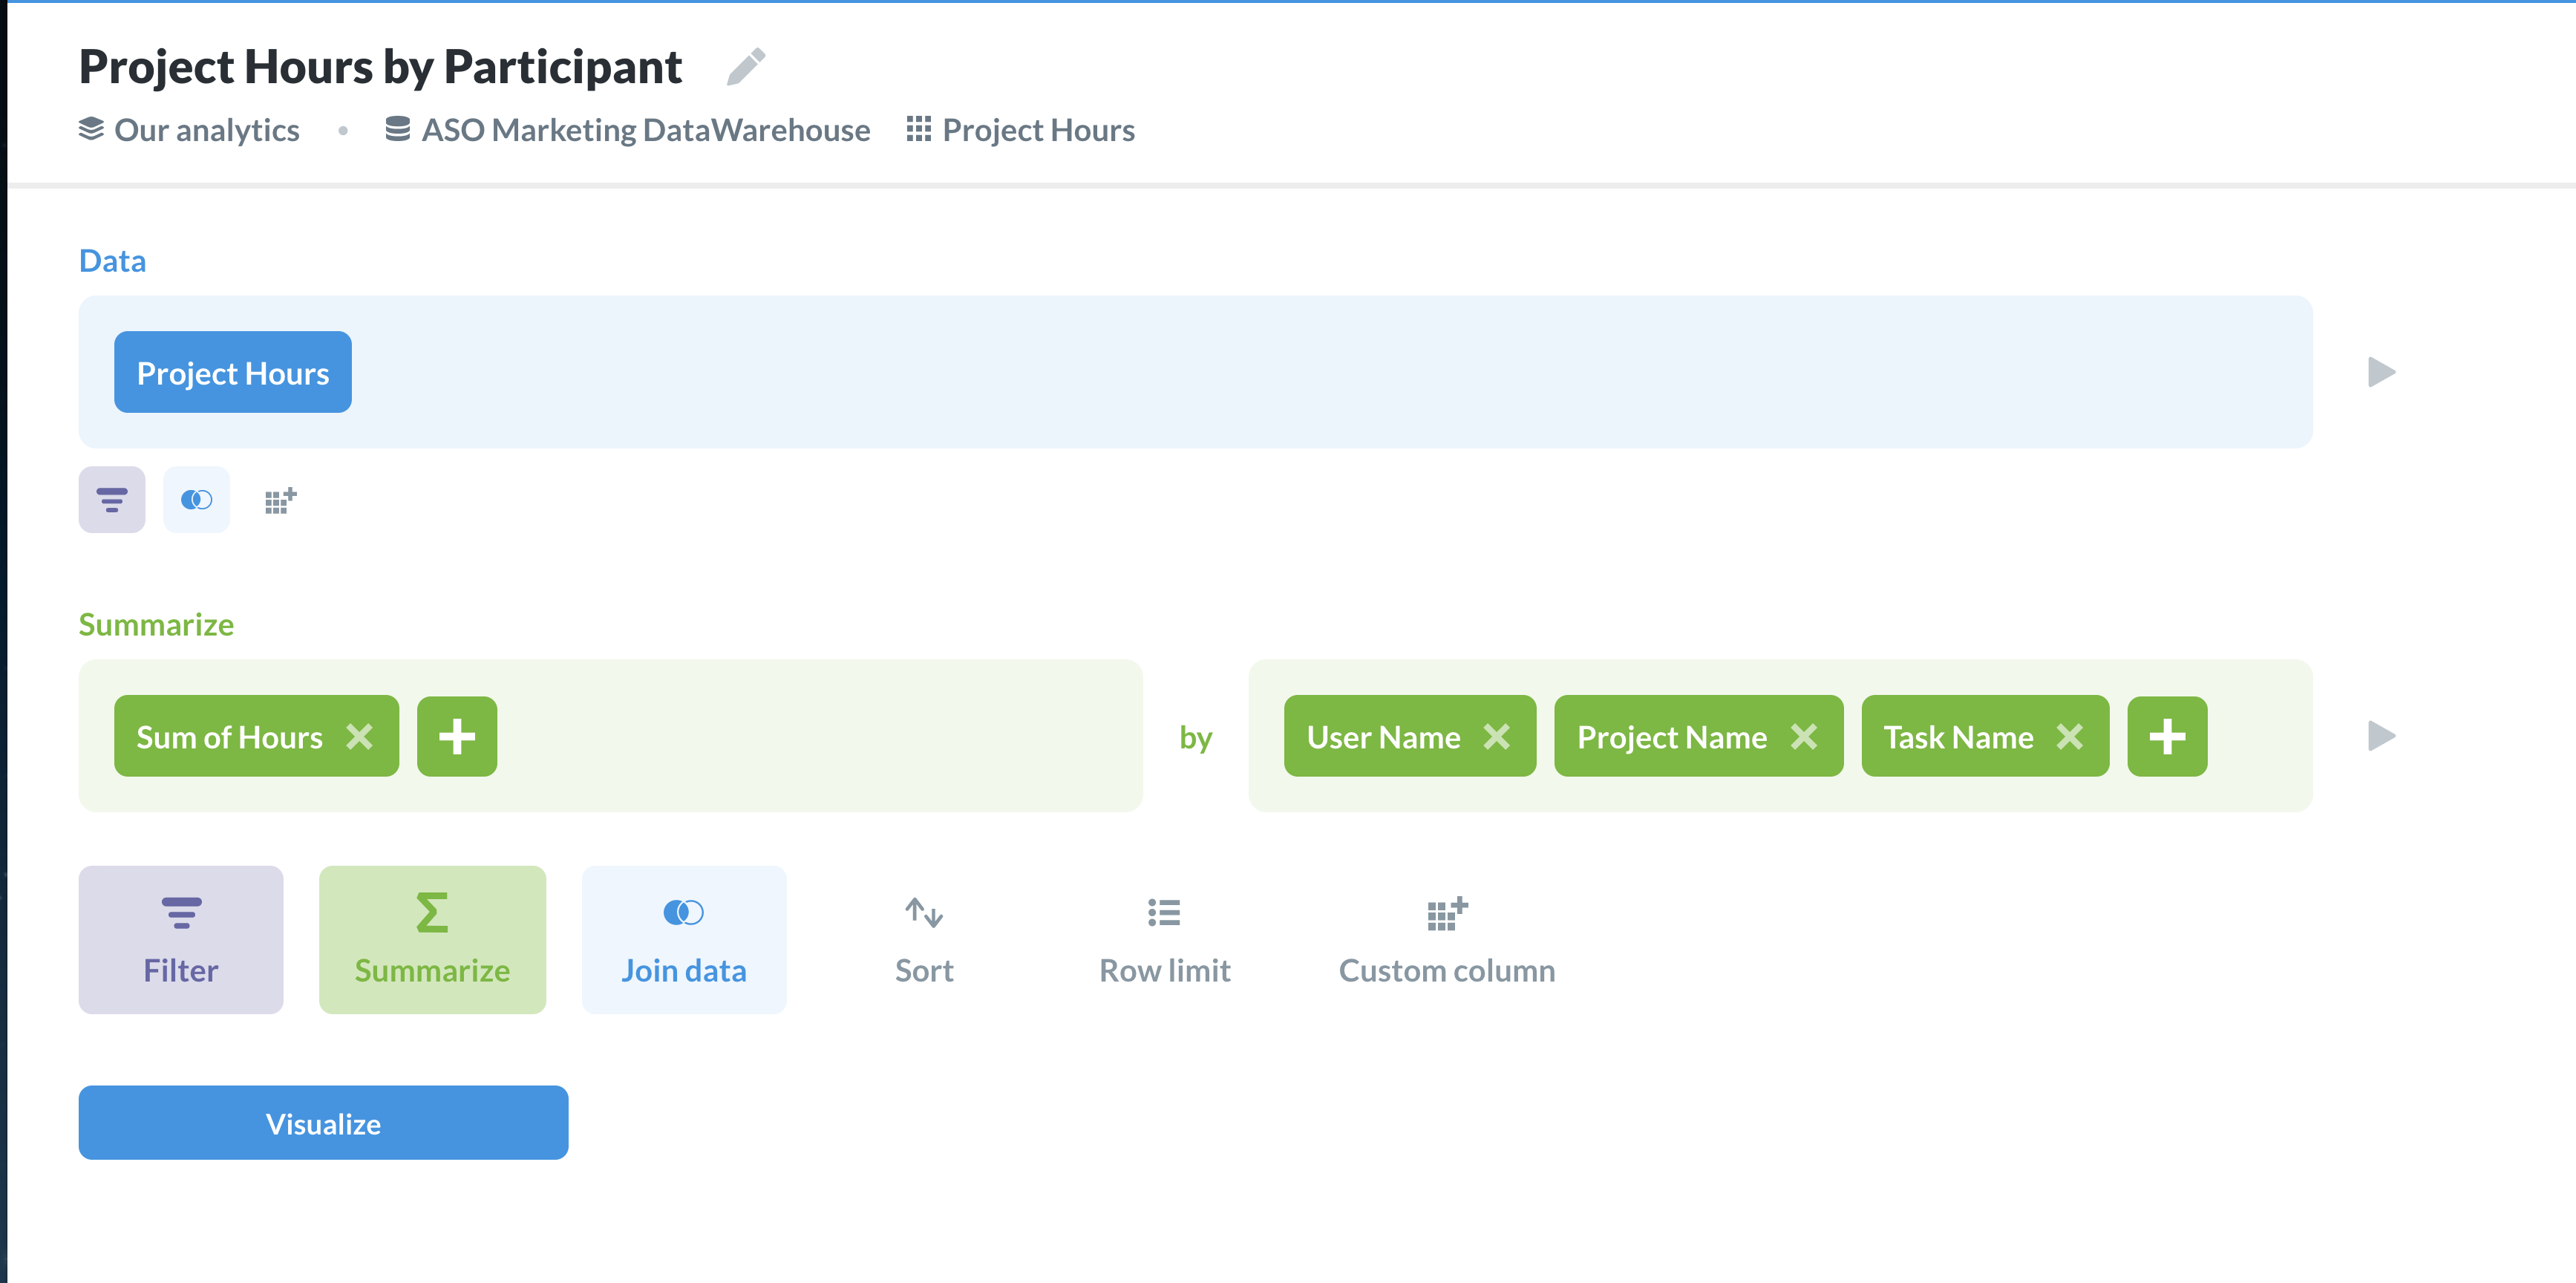
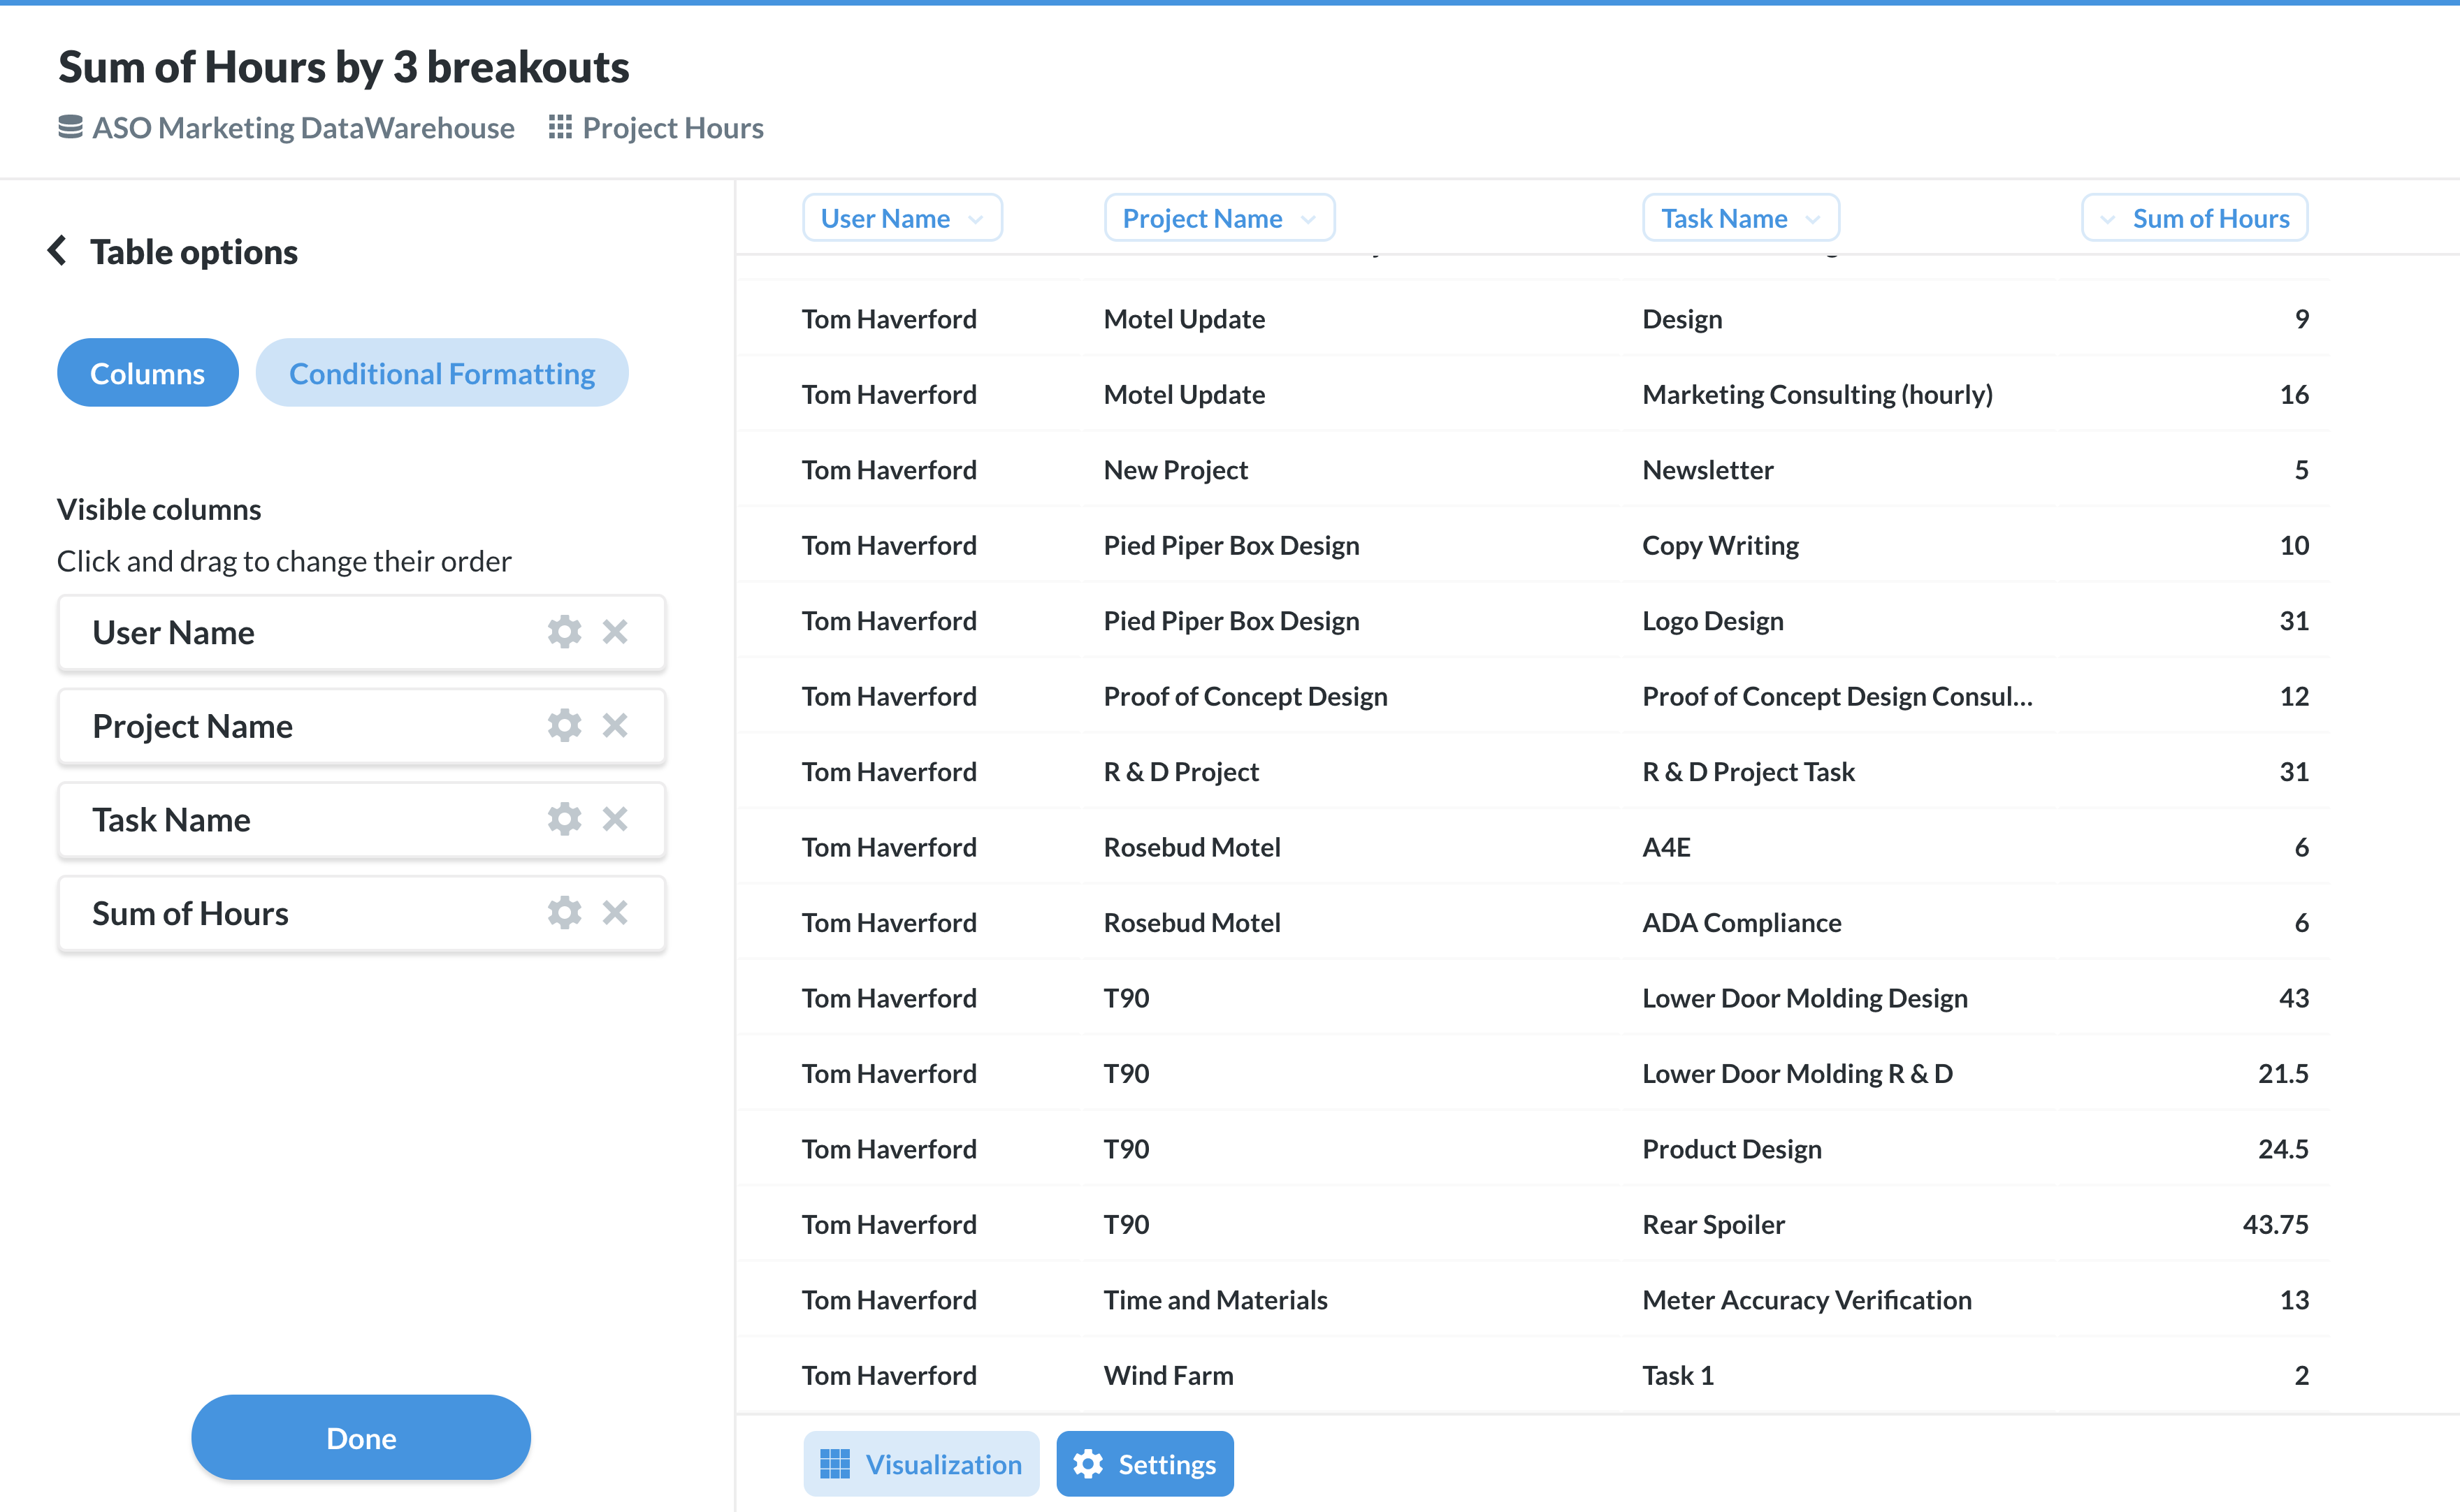
Last but not least, I wanted to see how many hours each of my project participants were putting in, based on project and task. To do this, I started with the Project Hours table, and summarized it by sum of hours, grouped by user name, project name, and task name.
Now, in my project dashboard, I get a snapshot of where all of my project hours are going to. The dashboard itself is configurable as well. I chose to add a relative date filter to mine, so I can see how those hours change over time. The relative date filter is different from other date ranges, because it is constantly updating, instead of showing a fixed date. Now, I have the option of seeing hours from the last week, the last 30 days, this month, etc. I also added filters for milestone status and user. Changing the filter in the dashboard will change all of the tables that are configured with that filter.
Updated 9/22/2025