Project Metabase Questions
As a project manager, I want to keep an eye on the hours that are worked for each project, based on the project, the milestones, and the tasks. I created a new dashboard to house these project tables in, and I created pie charts so I can see a snapshot of where the hours worked are going to.
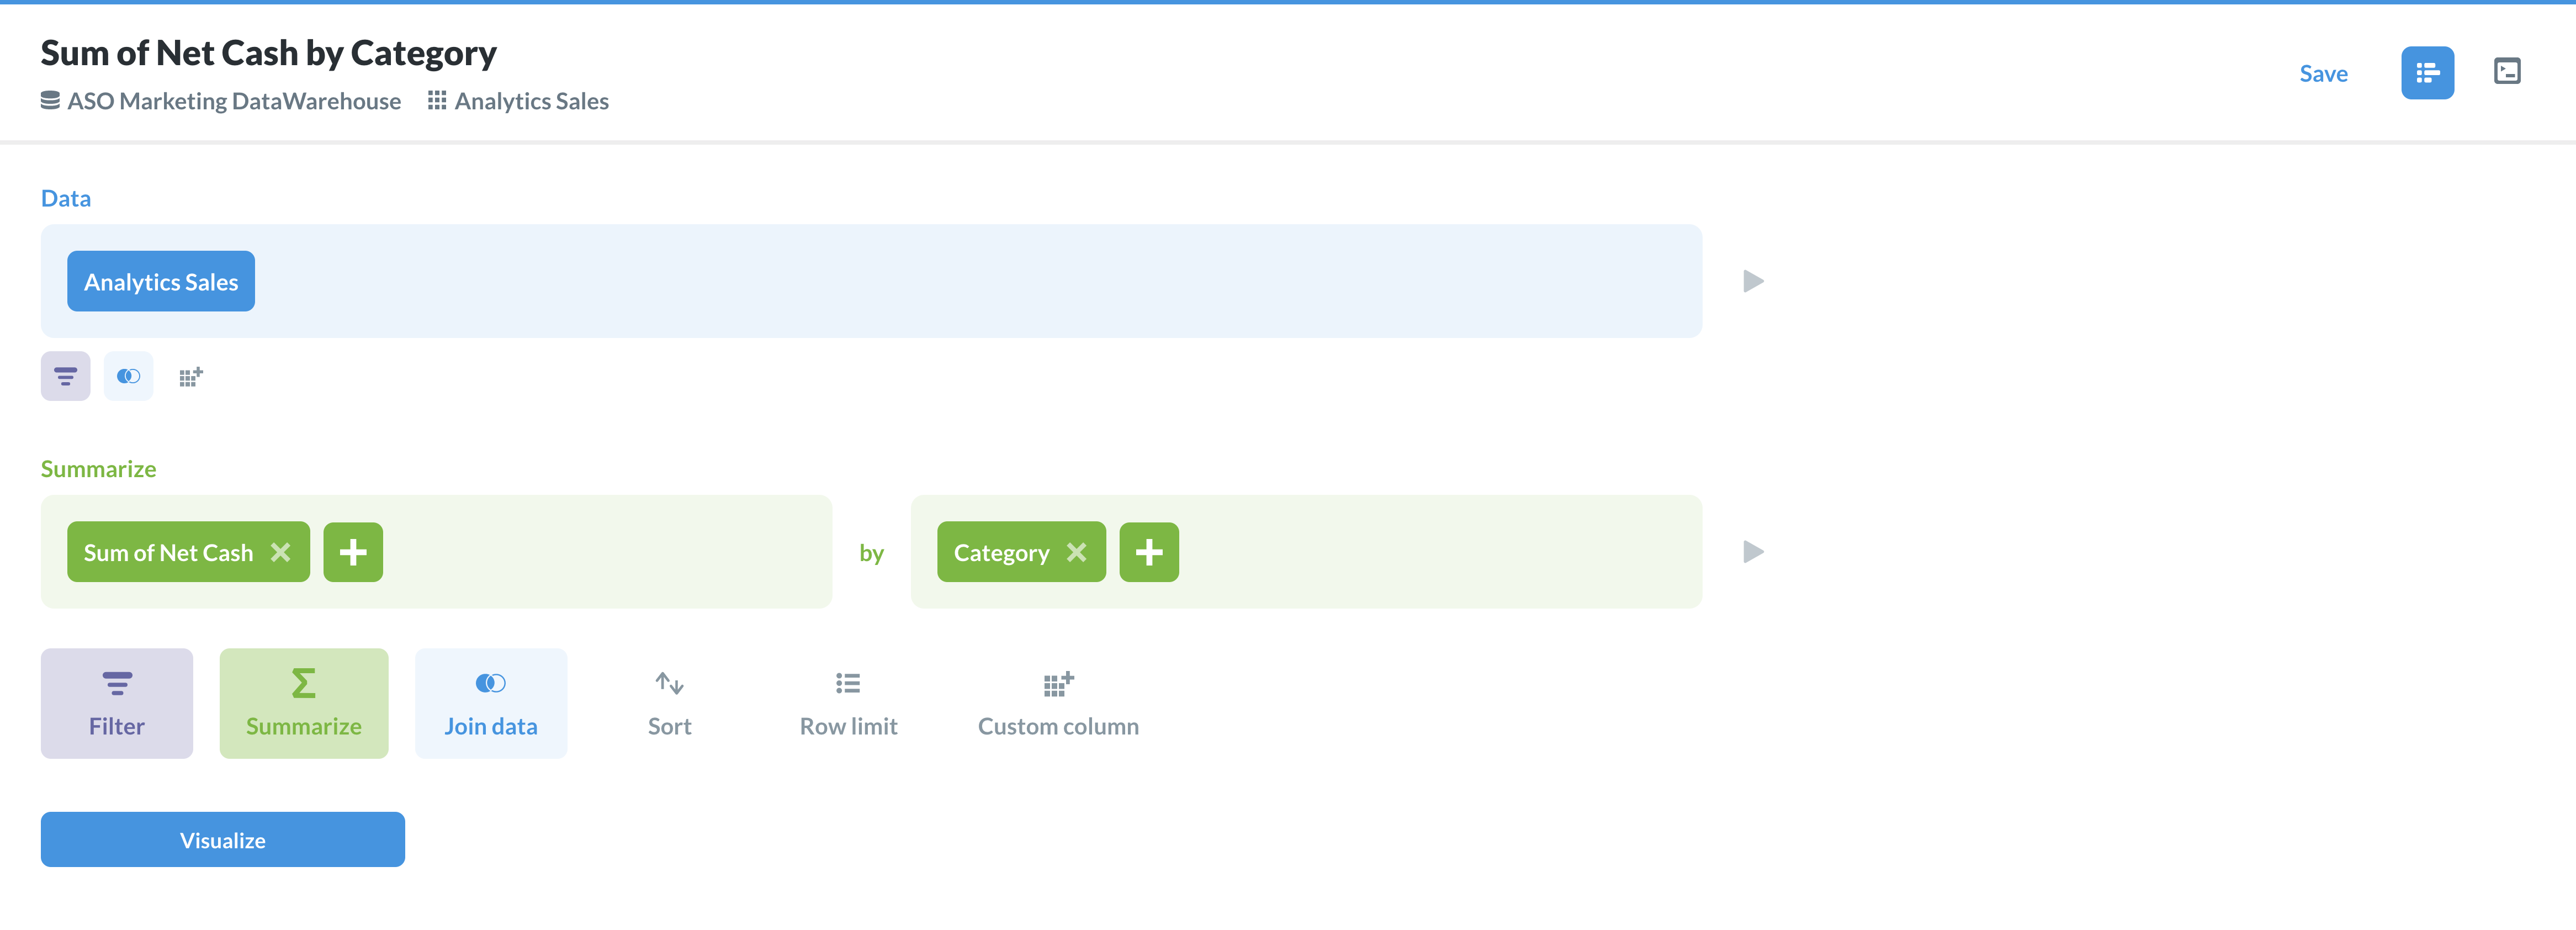
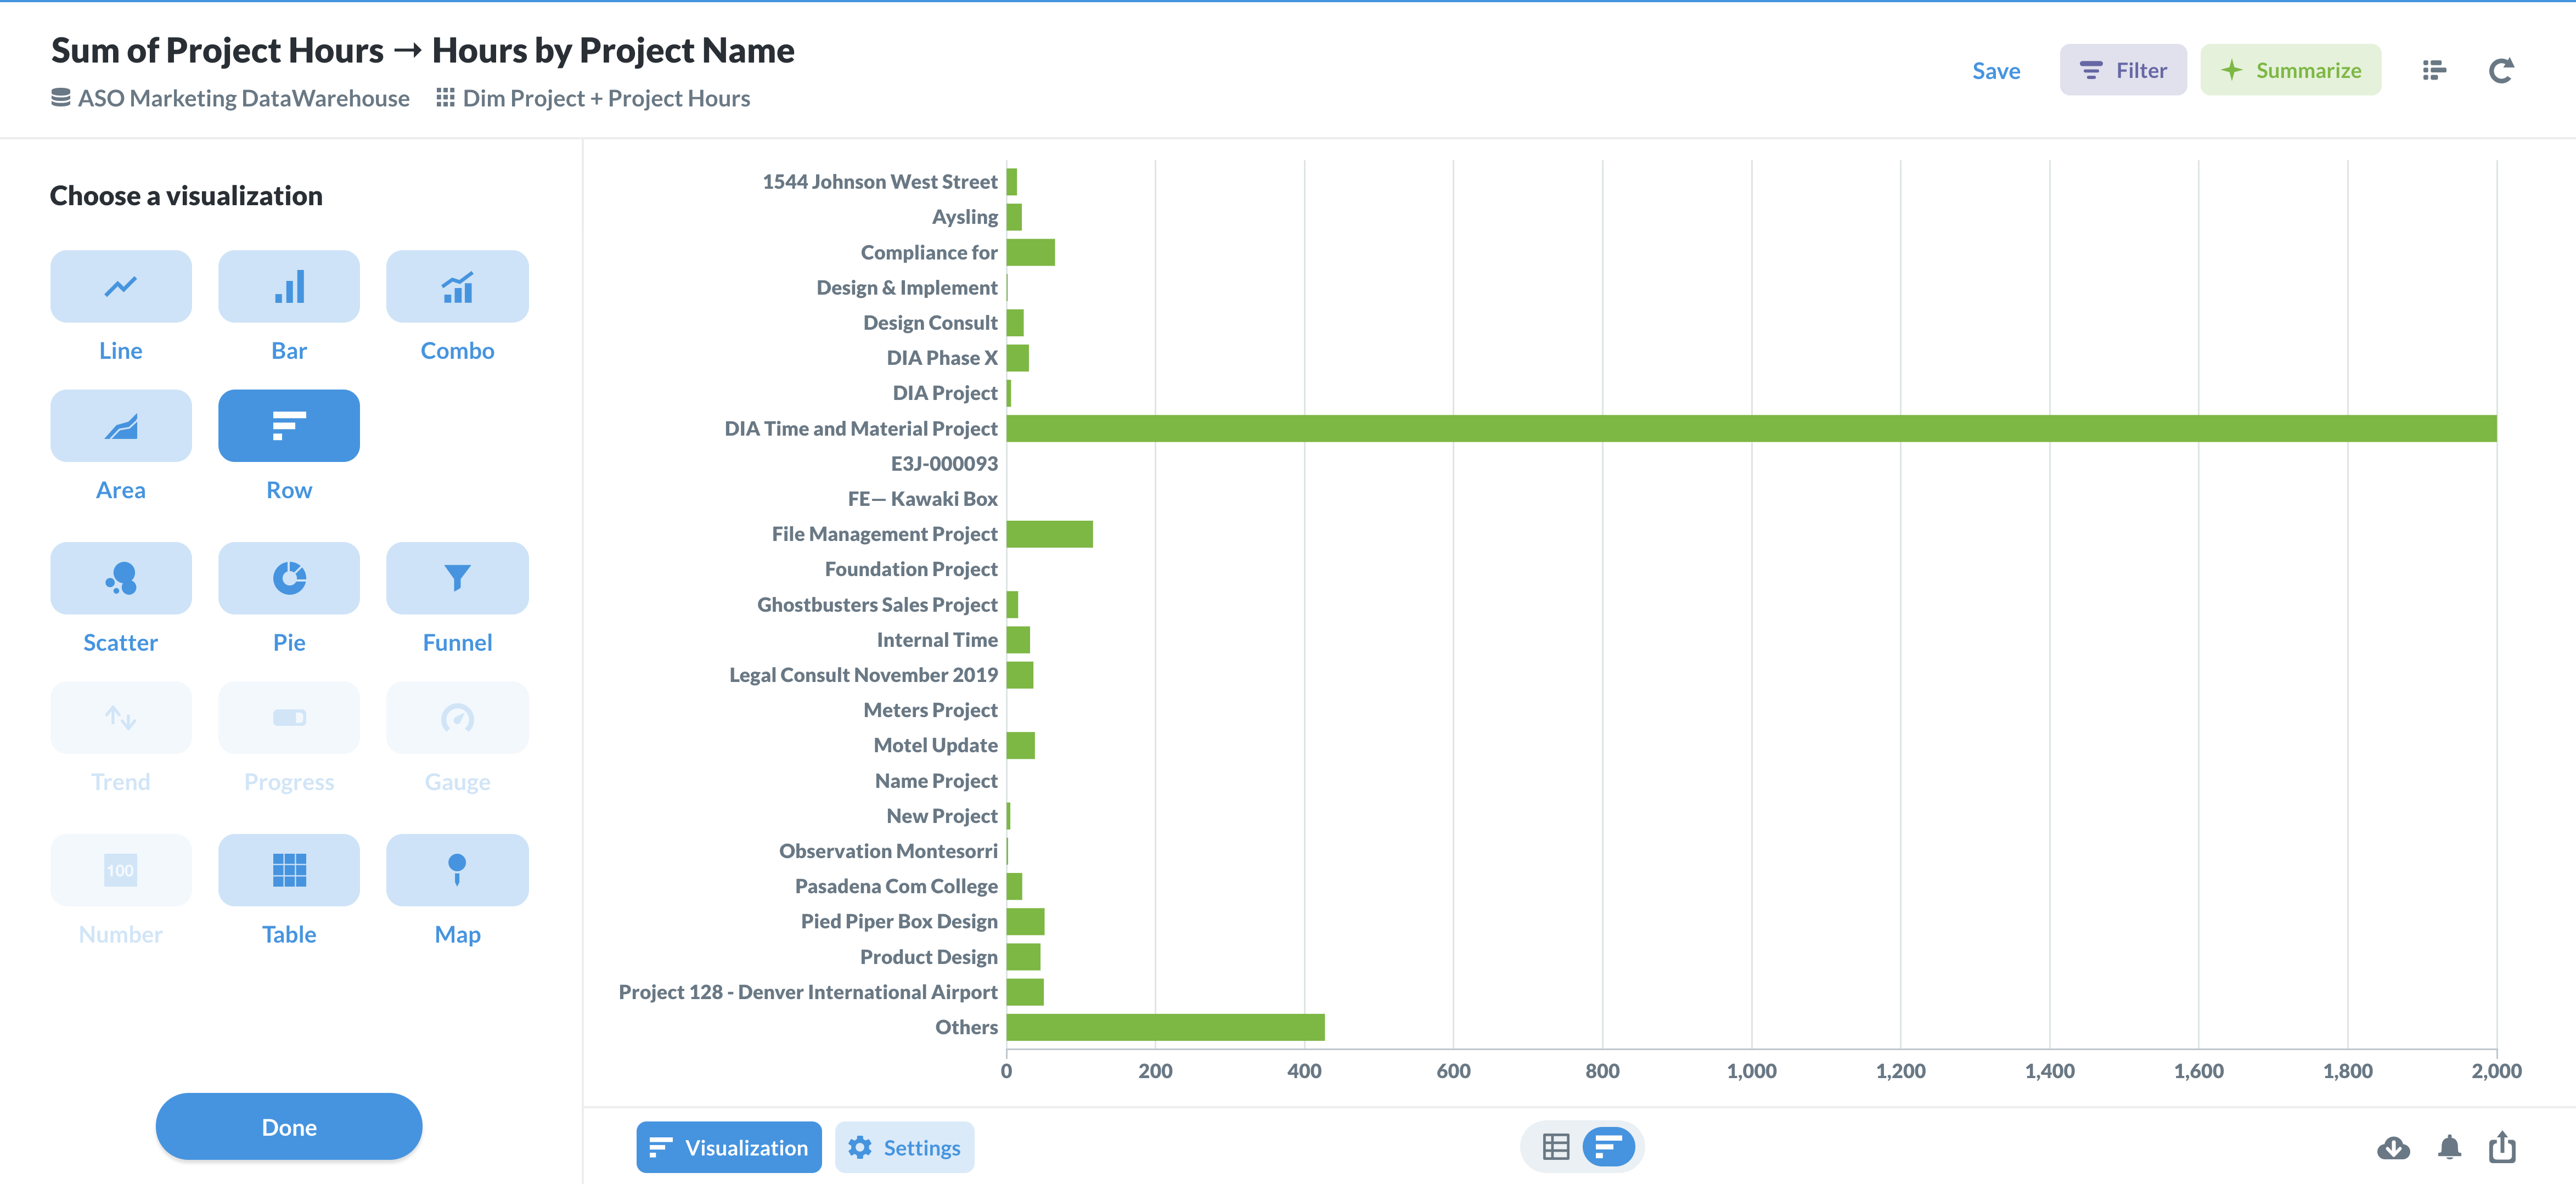
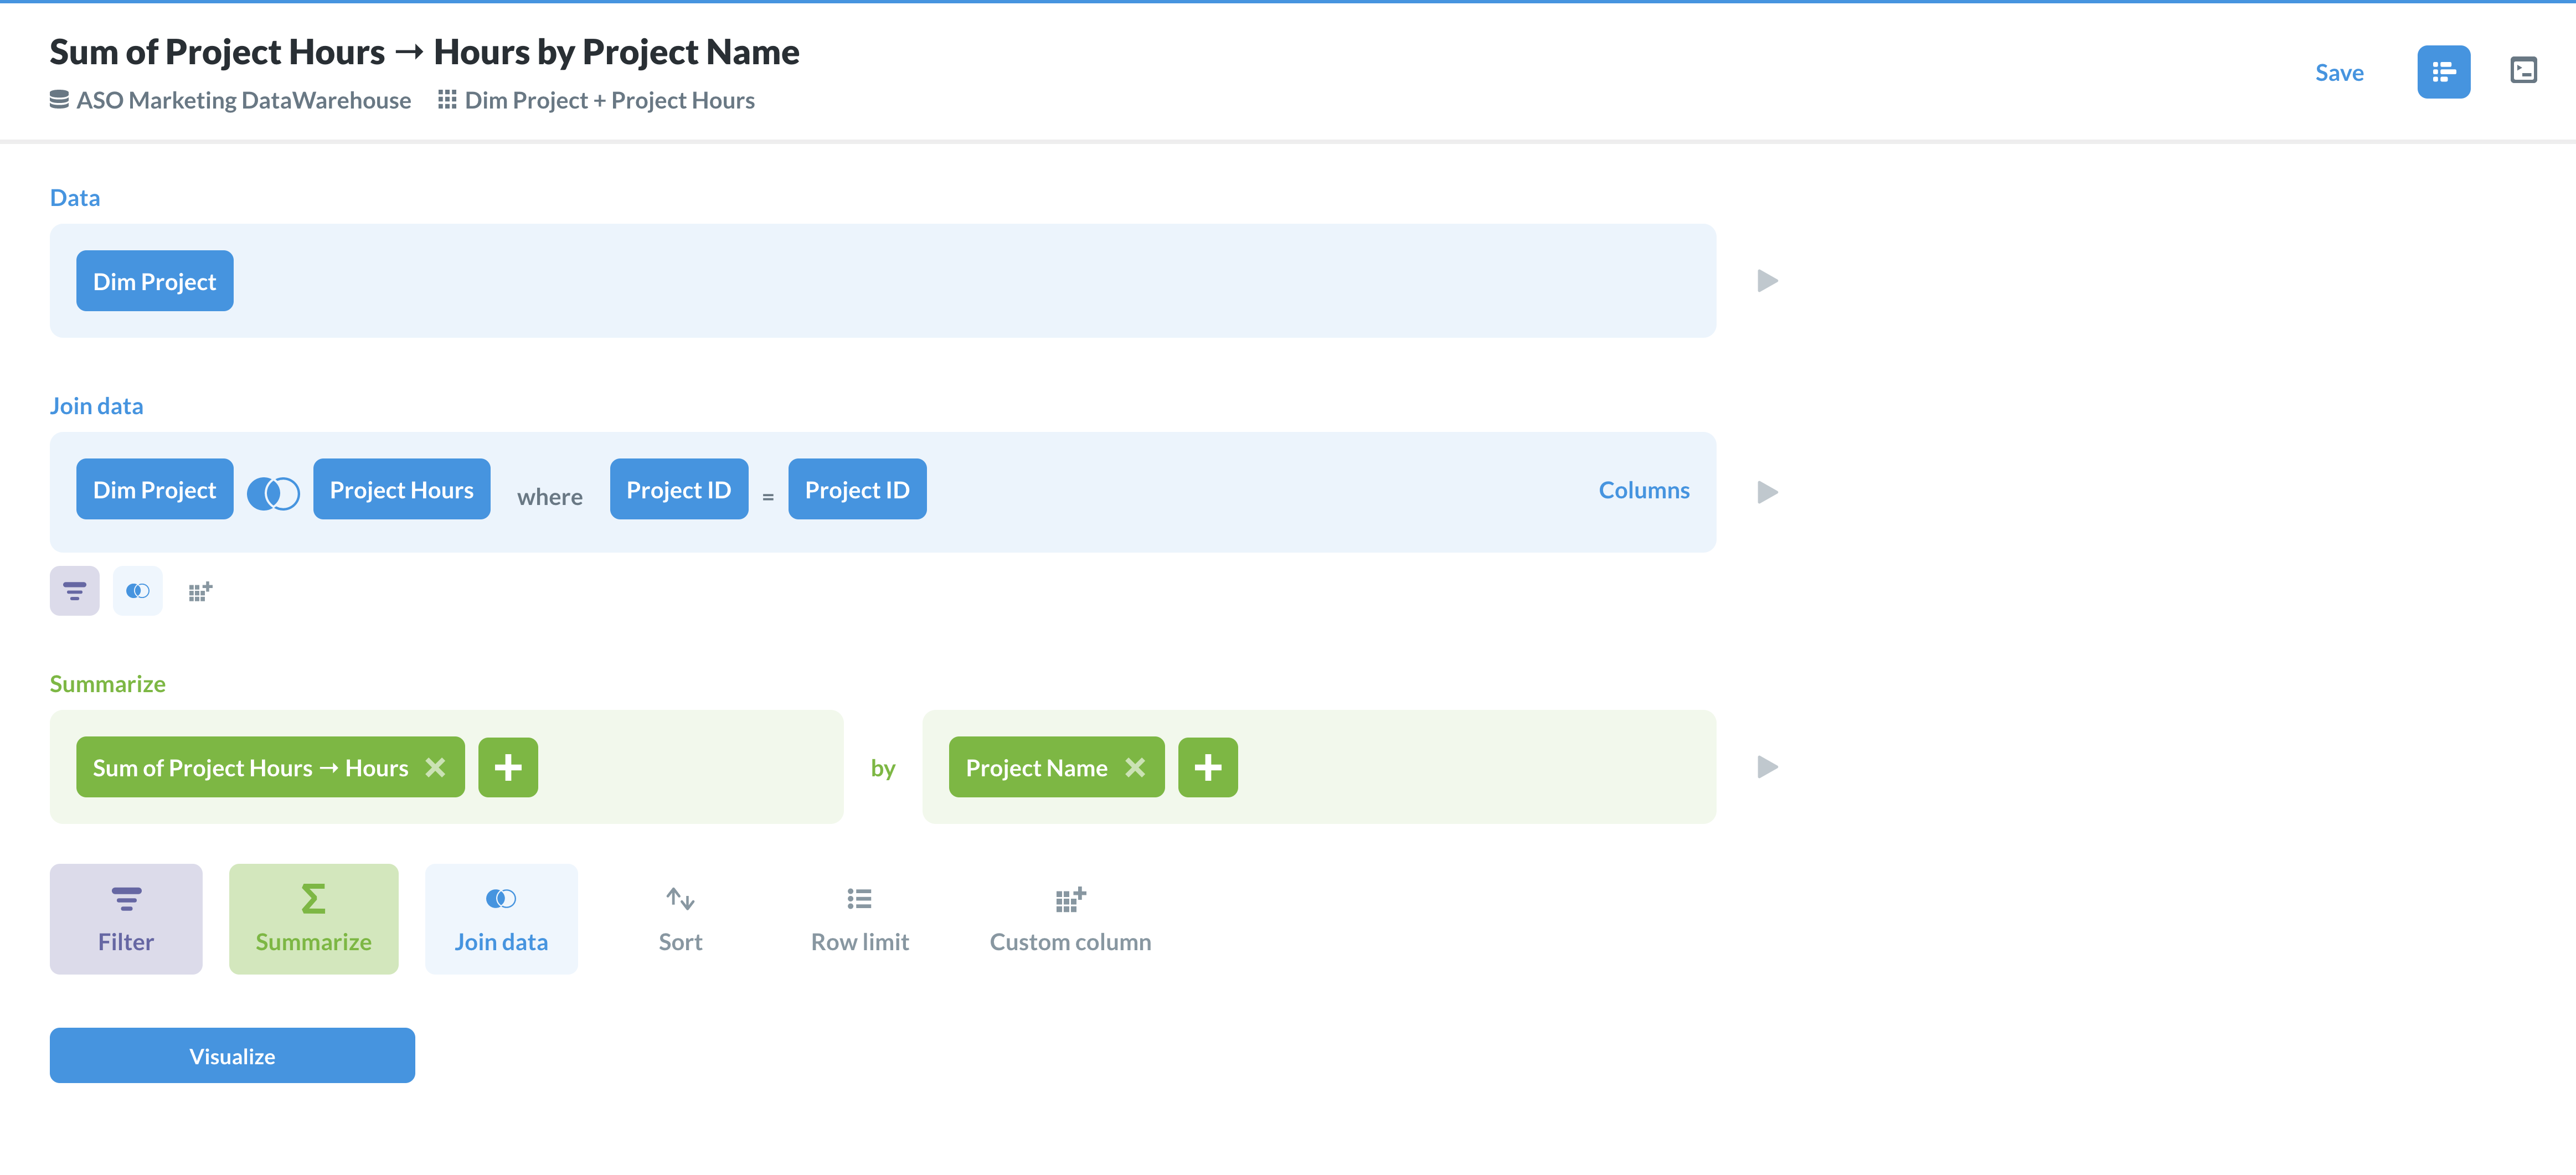
I started with the table Dim Project, and combined it with Project Hours. Then, I summarized the data by sum of project hours, grouped by project name. I changed the display to a pie chart, so I can easily view how many hours have gone into each project.
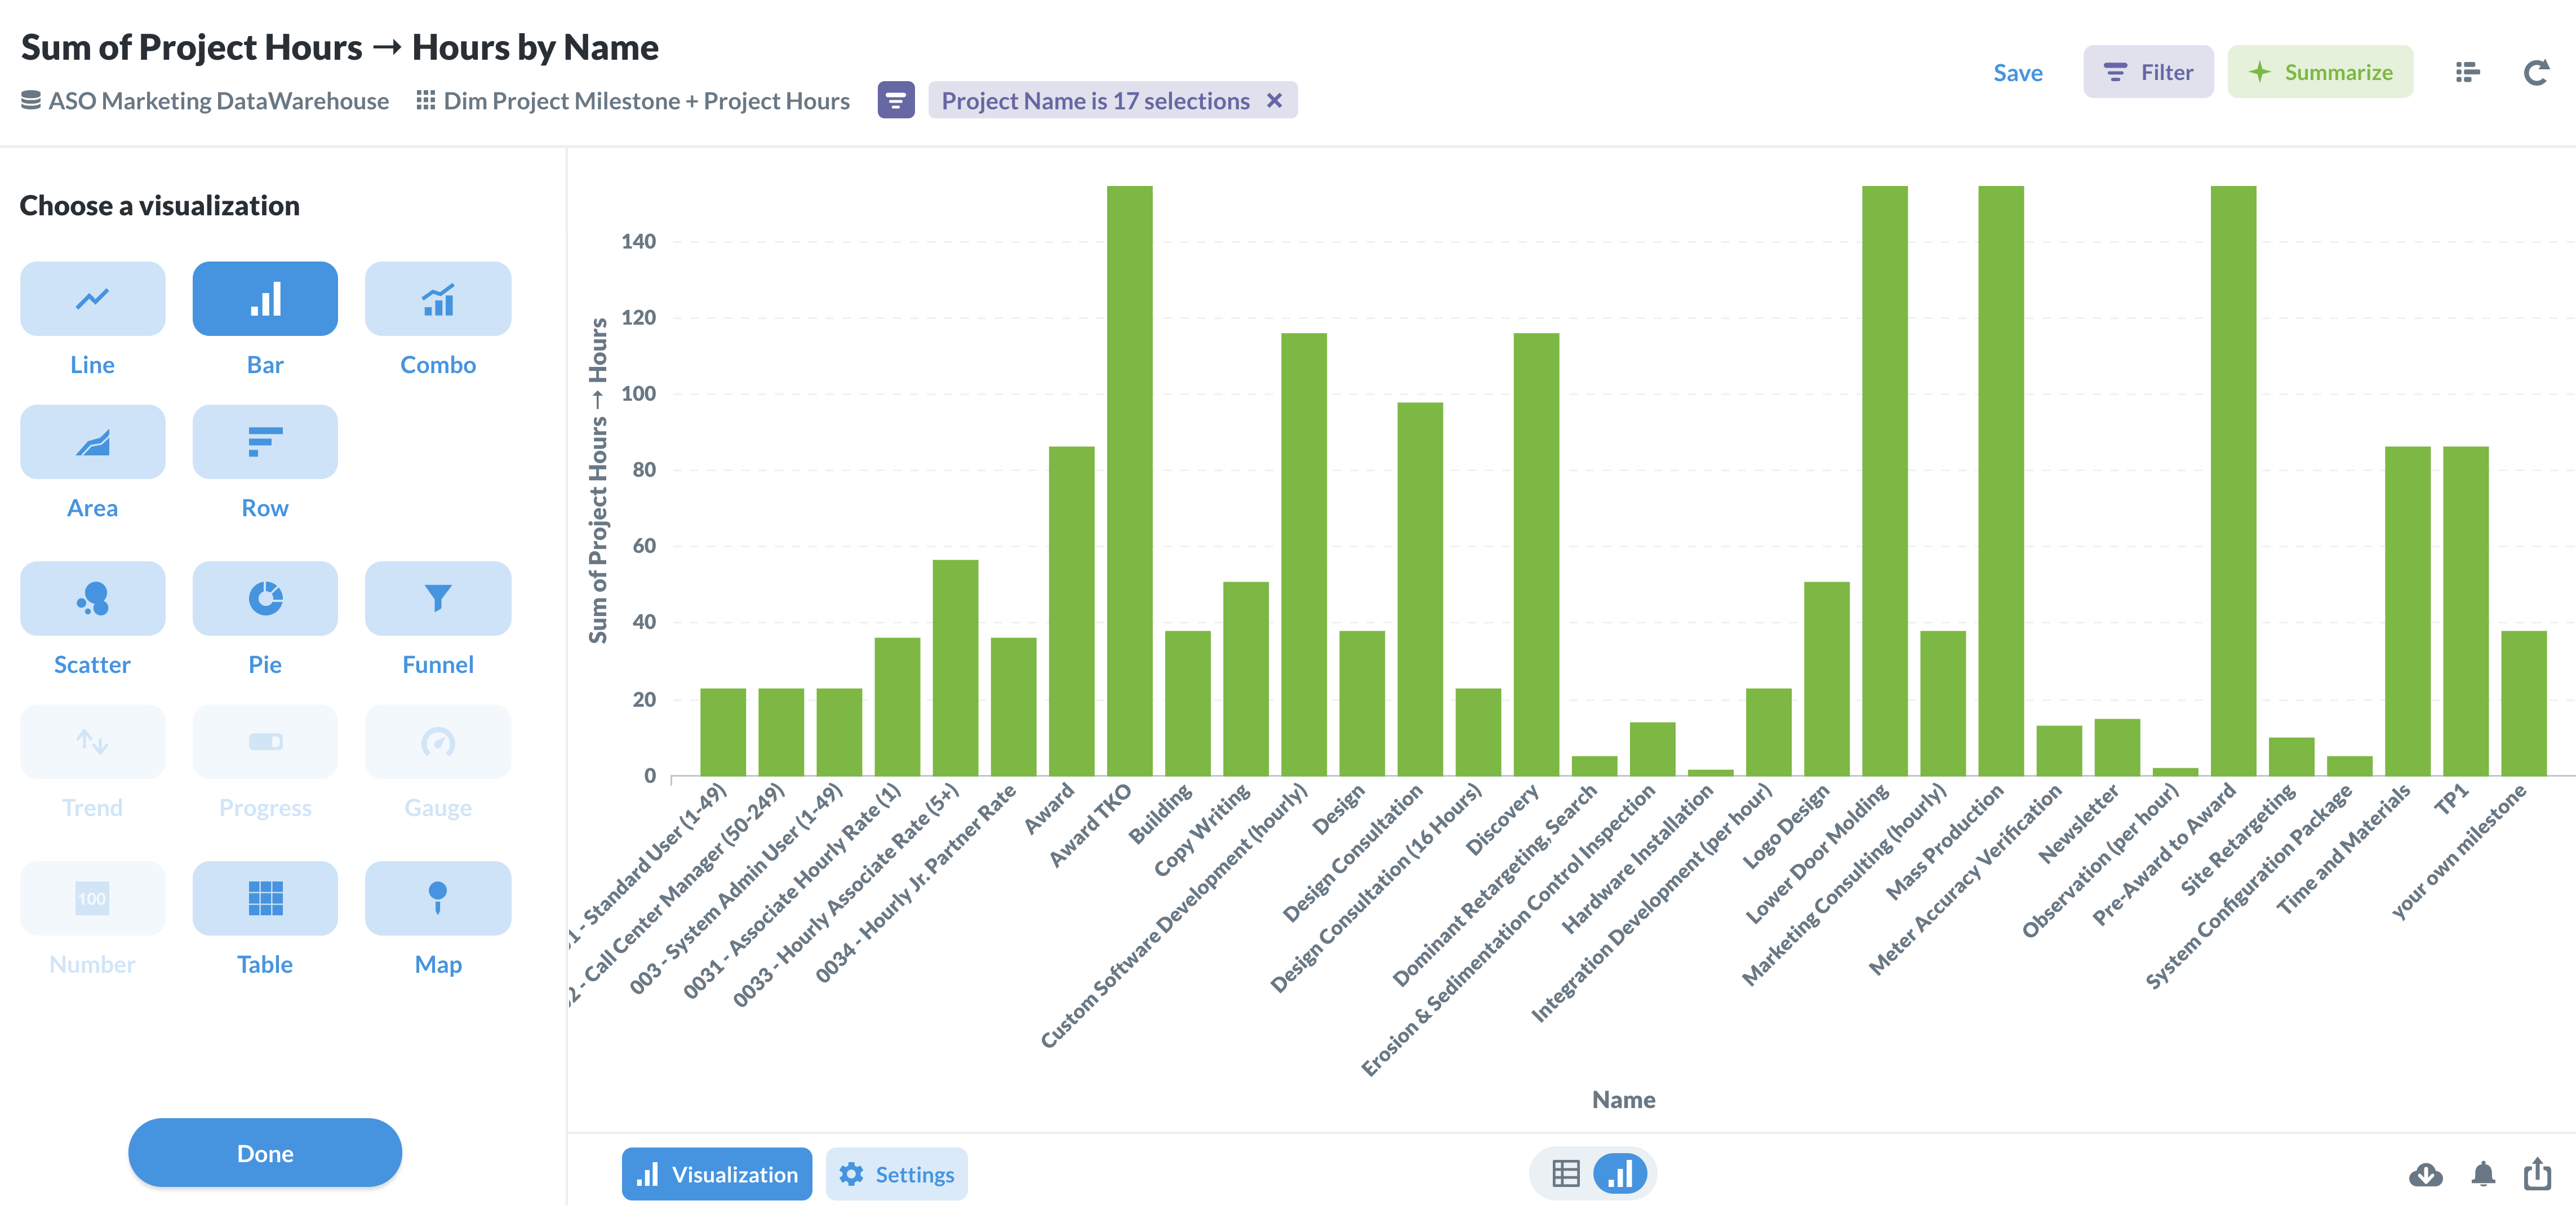
My next table was for my project milestones. I started with the Dim Project Milestone table, and formatted the table in the exact same way as my Dim Project table.
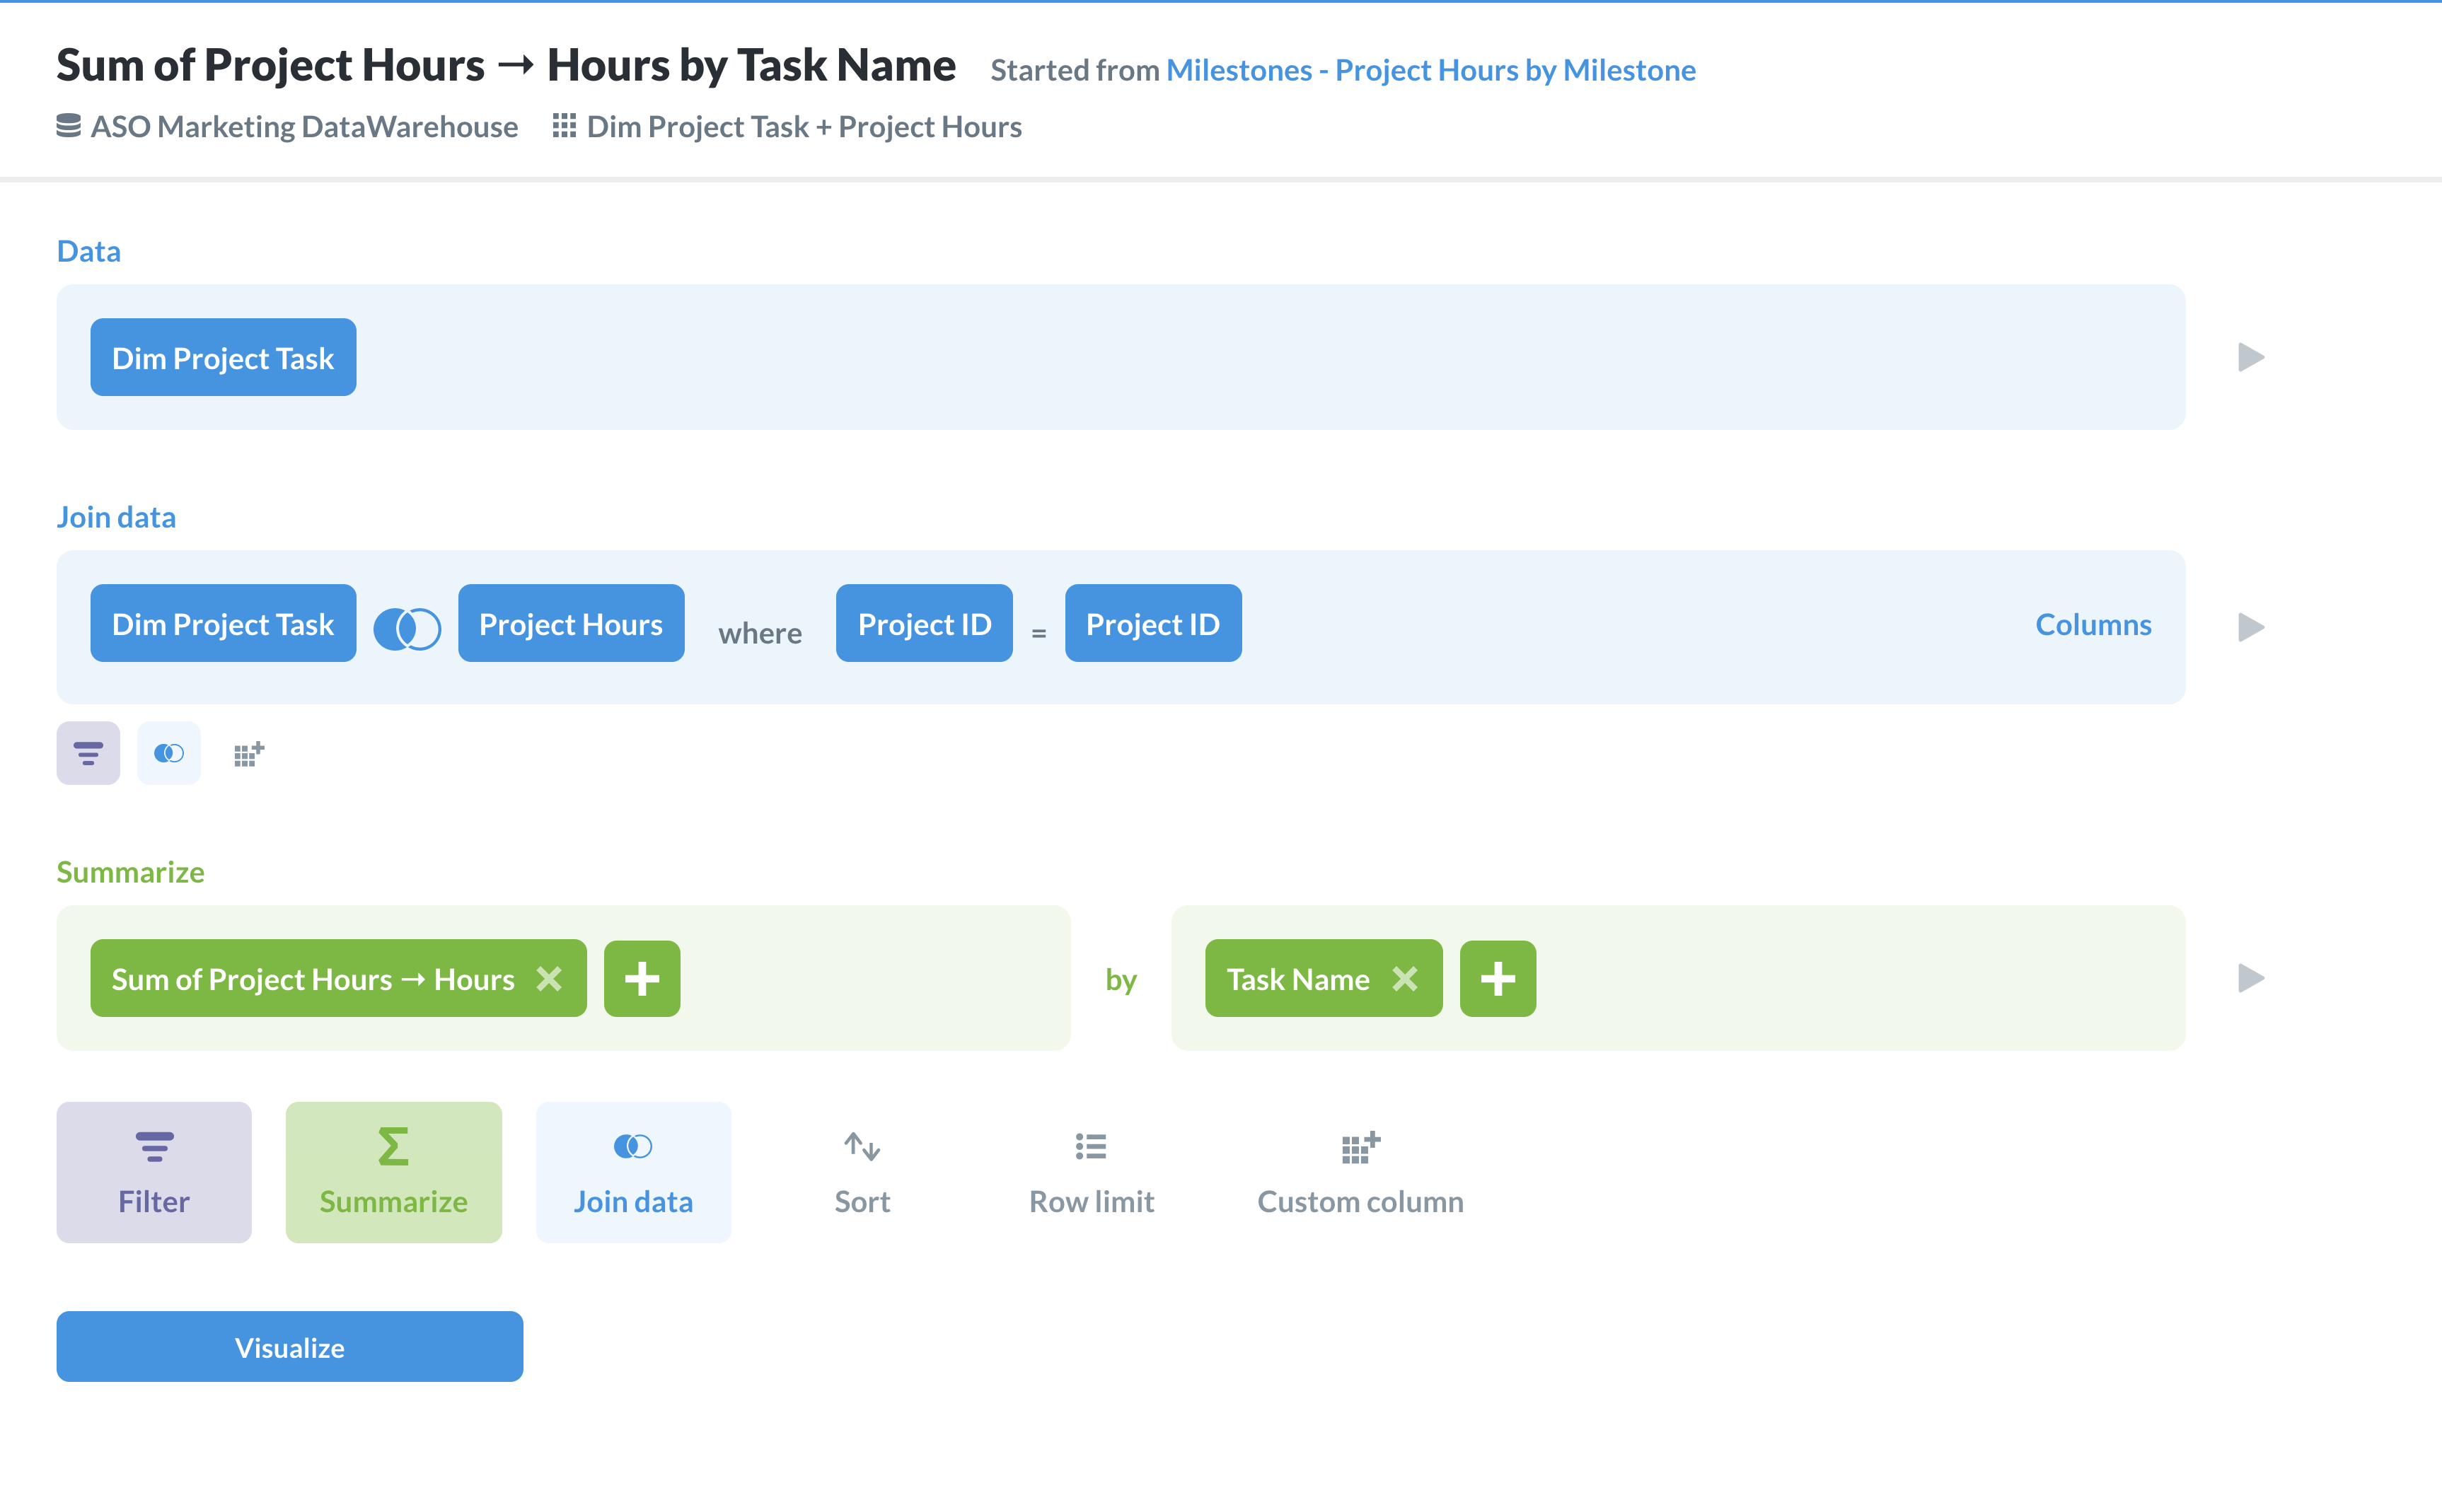
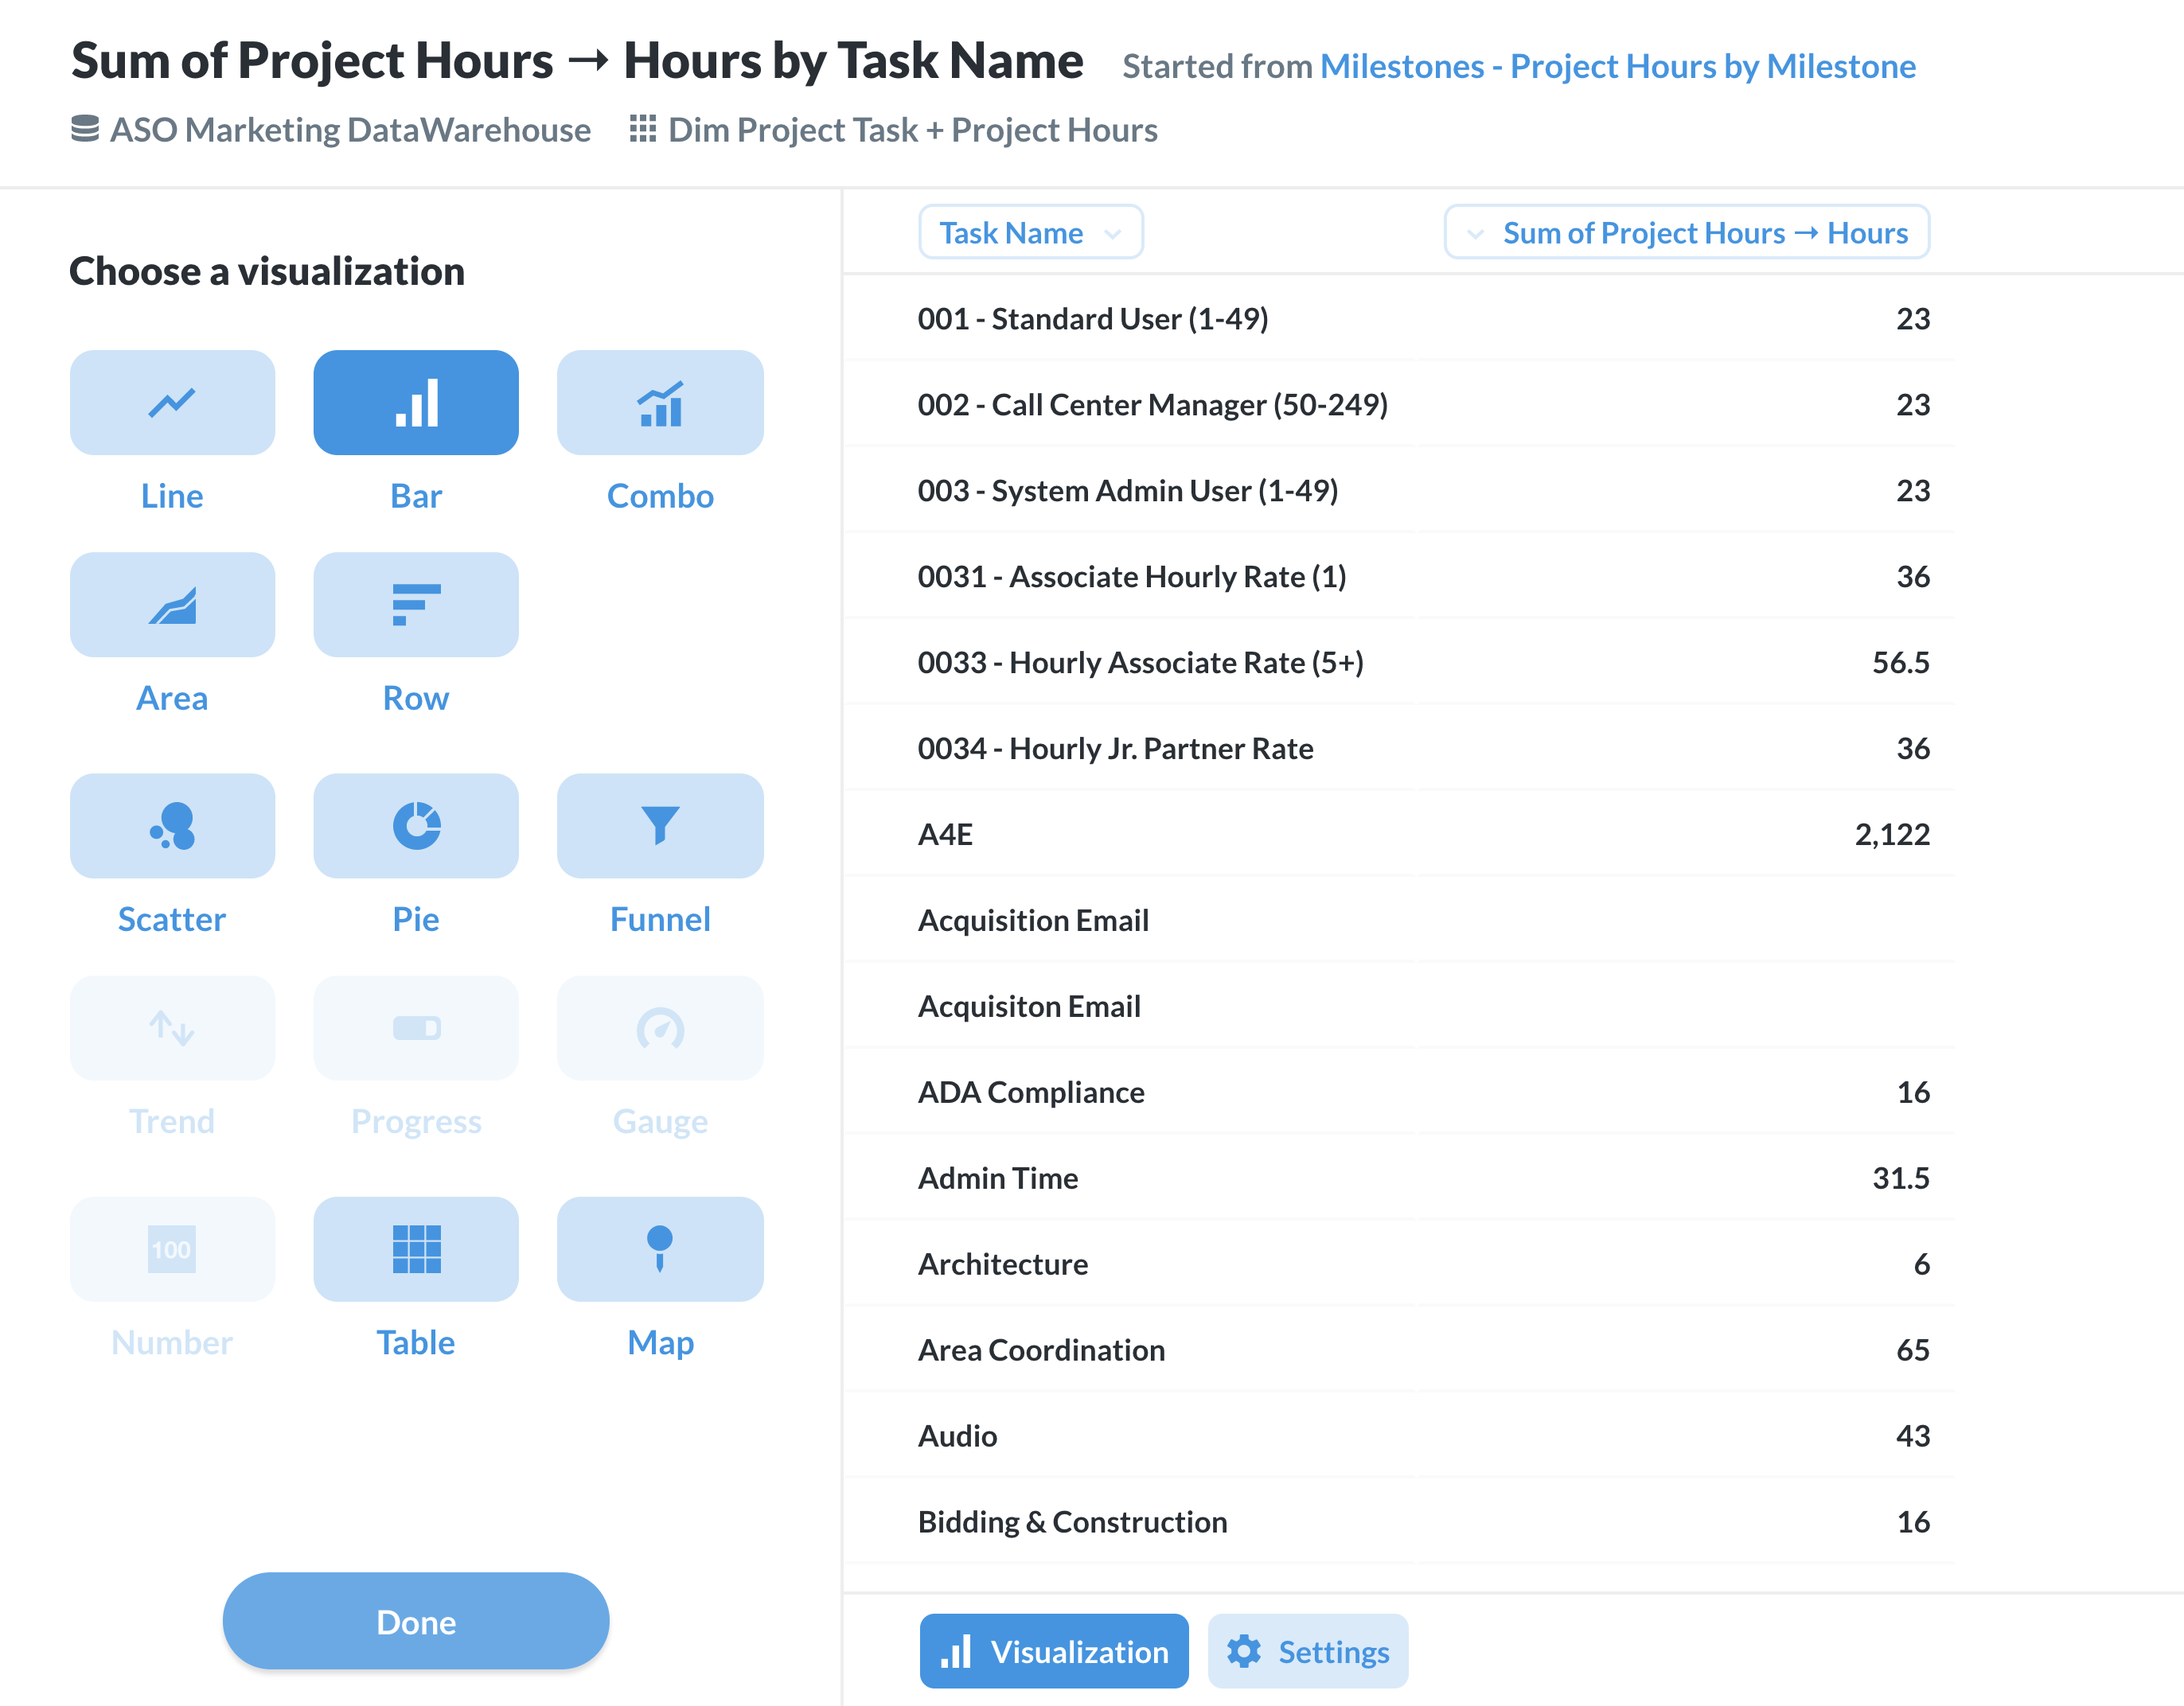
My next table was for my project tasks. I started with the Dim Project Task table, and formatted the table in the exact same way as my Dim Project table.
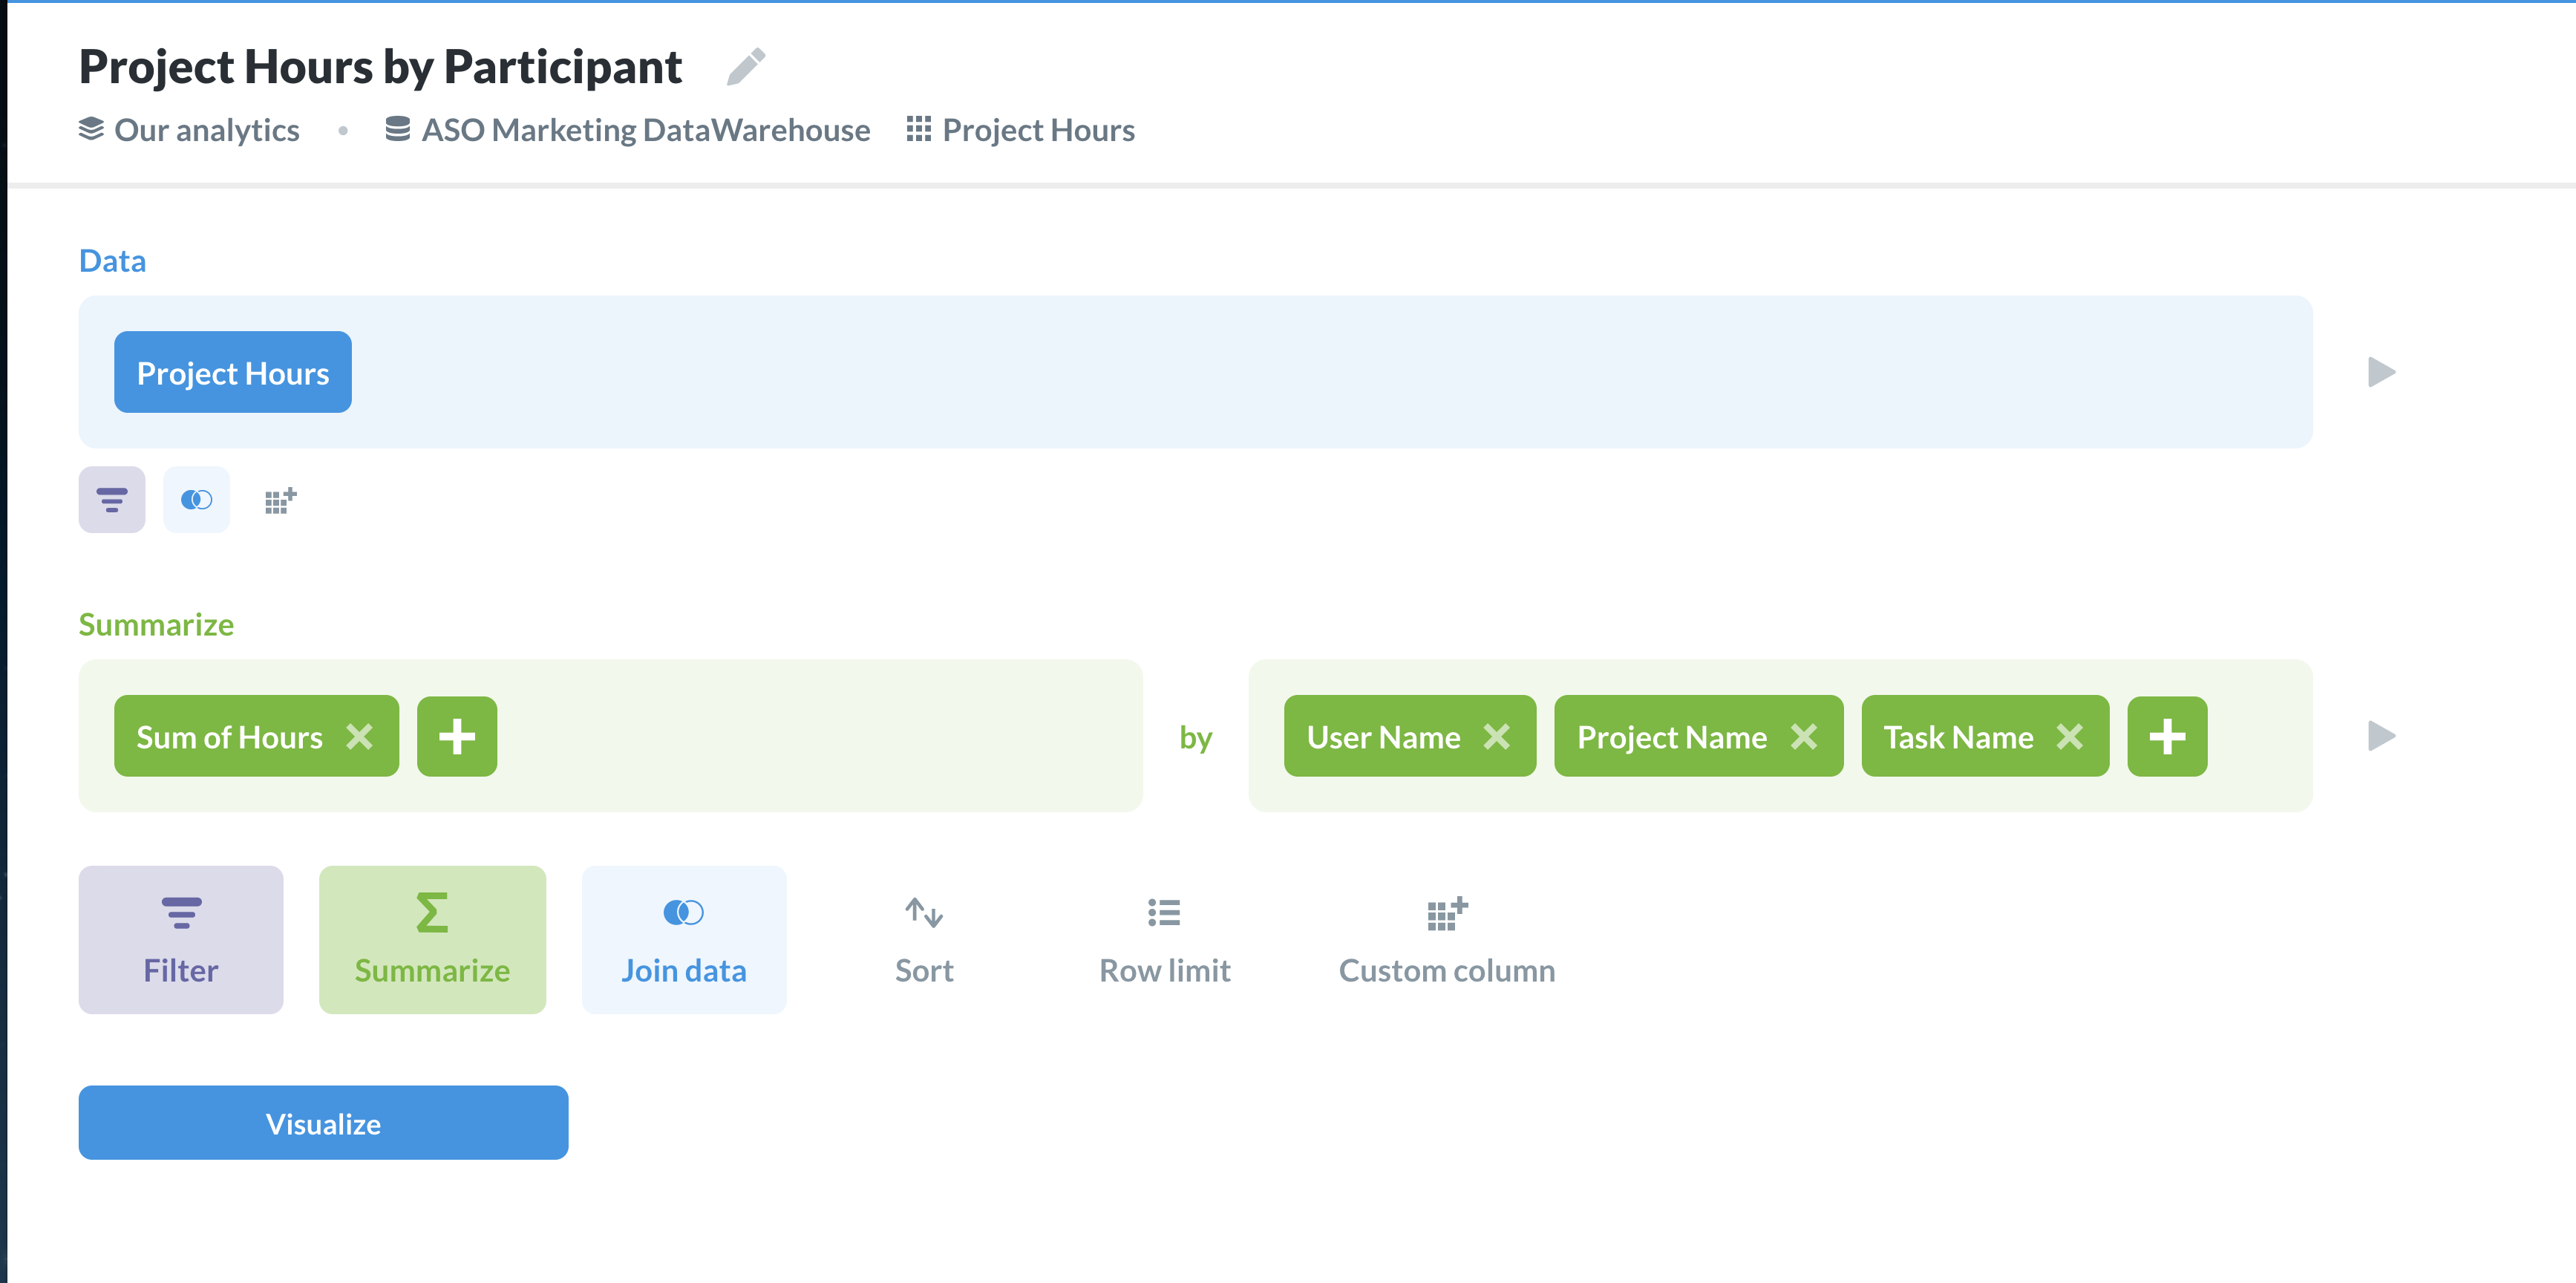
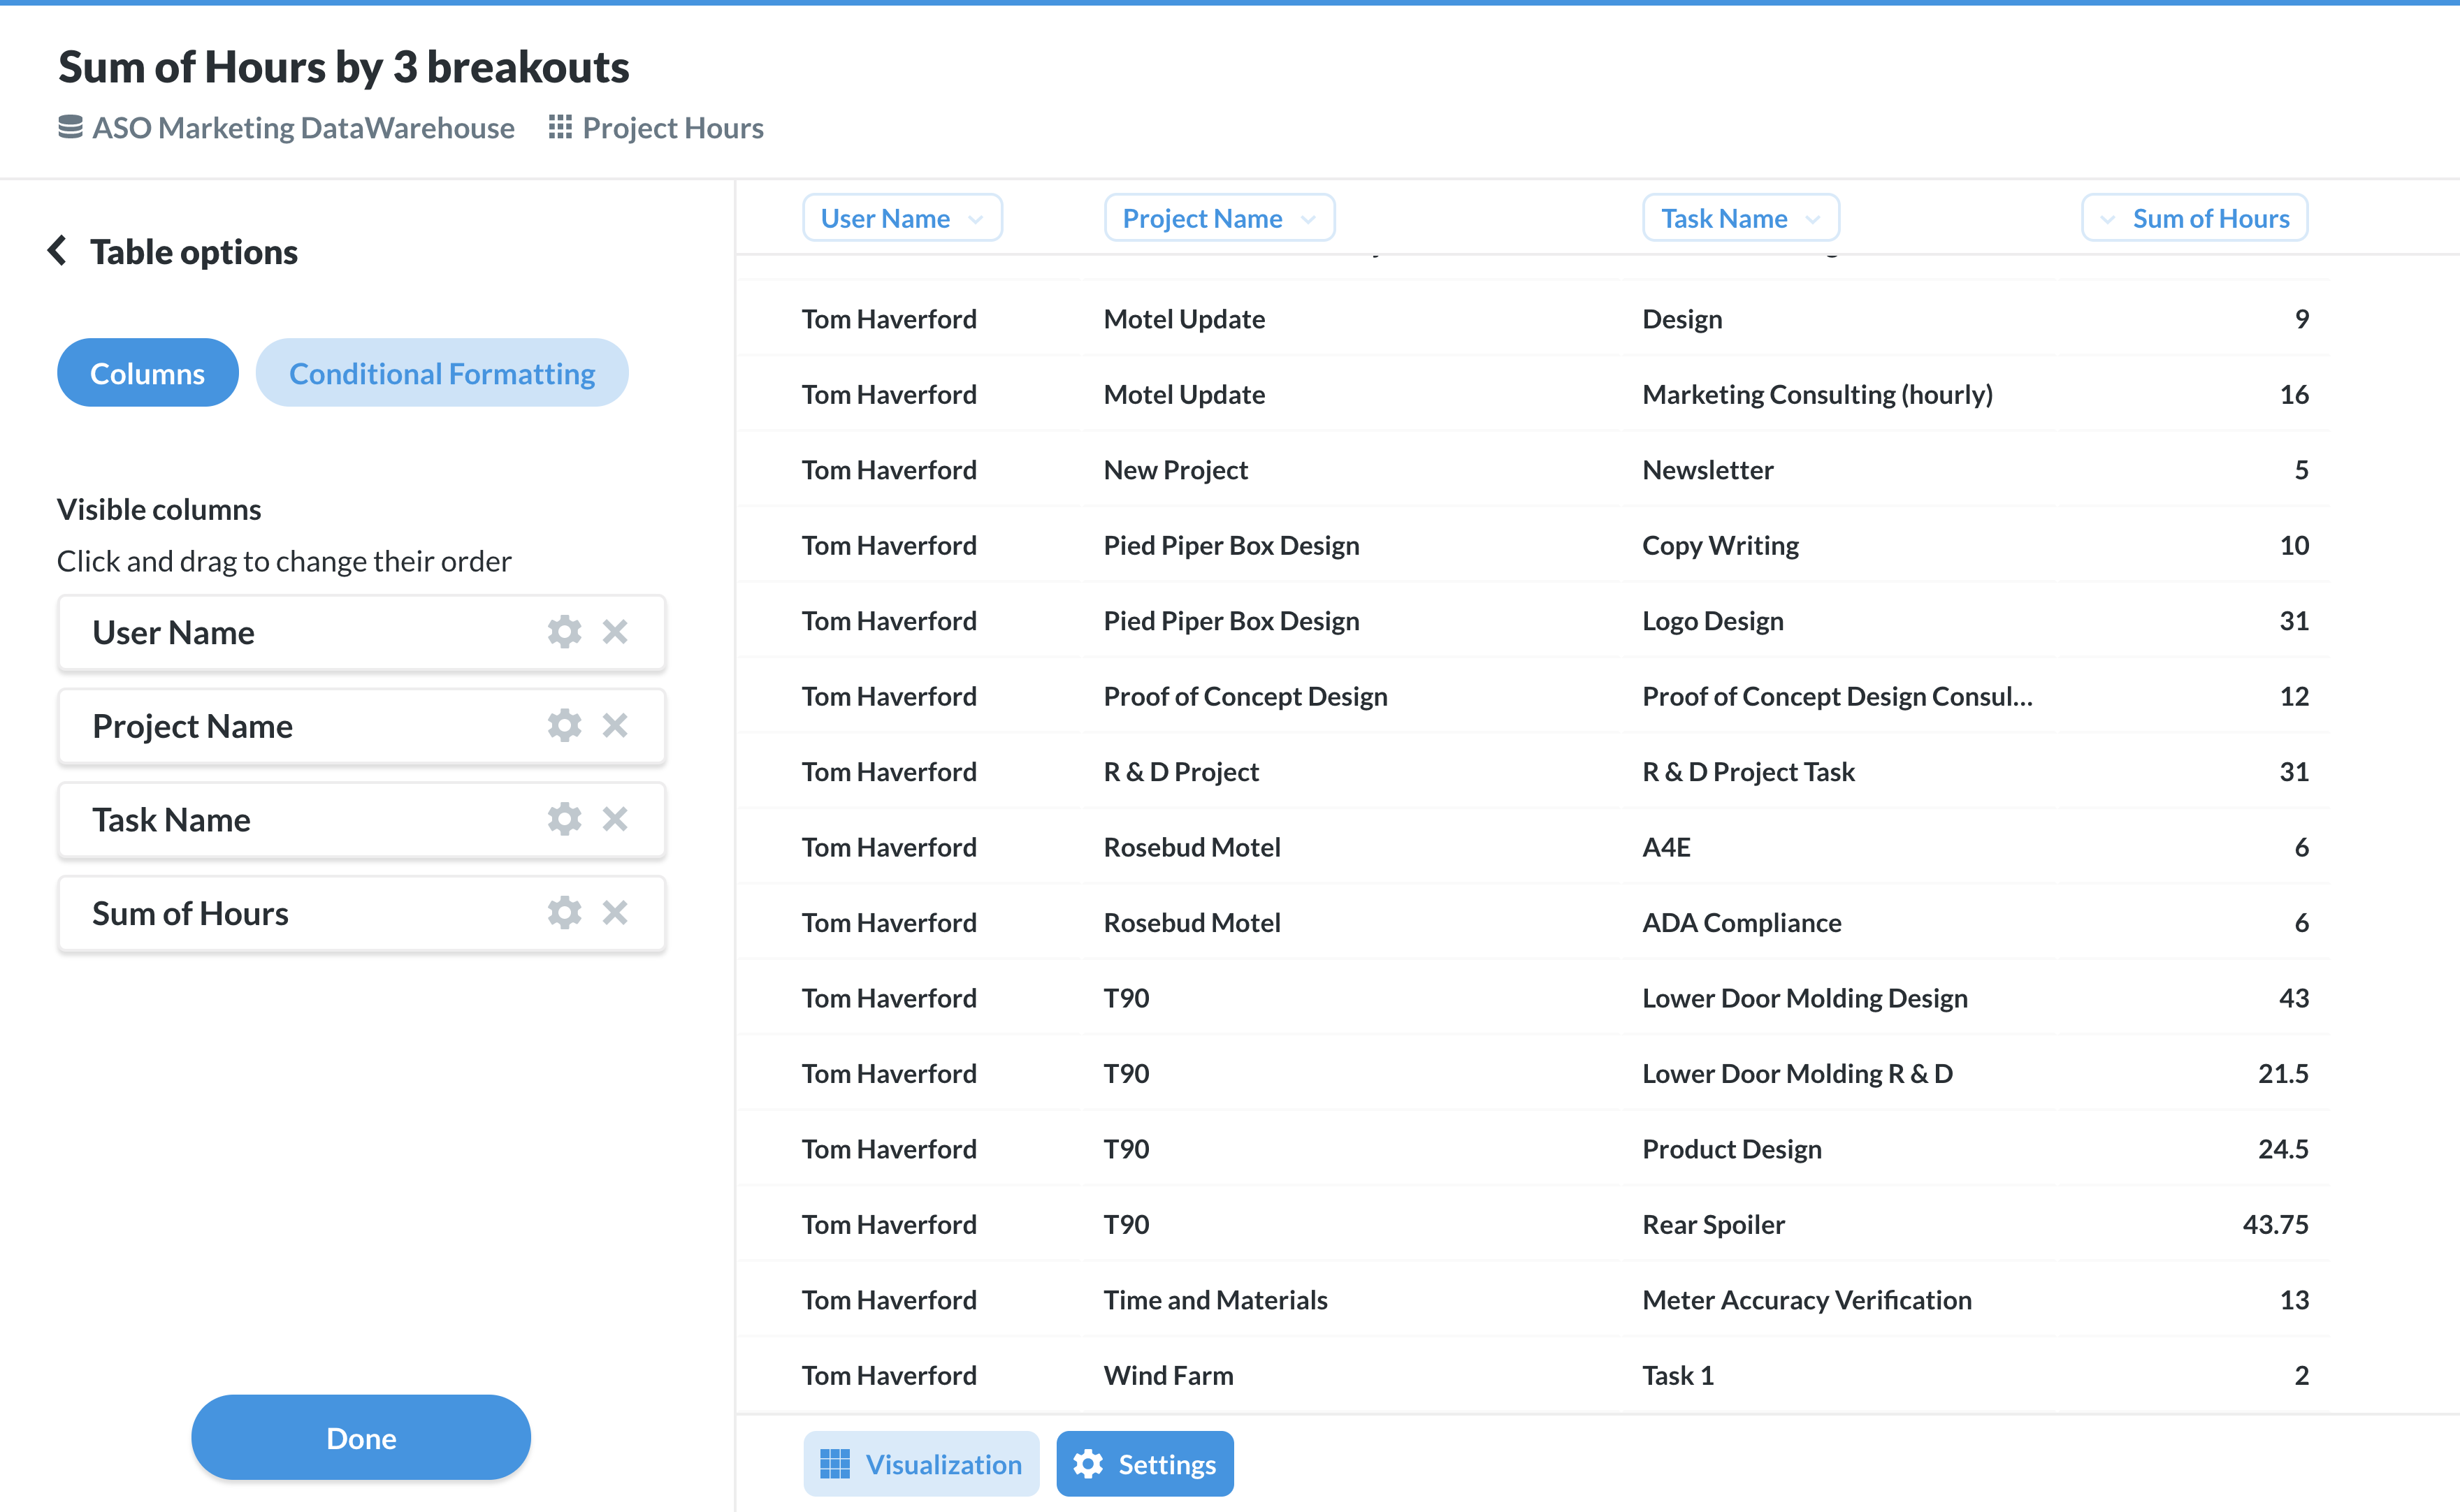
Last but not least, I wanted to see how many hours each of my project participants were putting in, based on project and task. To do this, I started with the Project Hours table, and summarized it by sum of hours, grouped by user name, project name, and task name.
Now, in my project dashboard, I get a snapshot of where all of my project hours are going to. The dashboard itself is configurable as well. I chose to add a relative date filter to mine, so I can see how those hours change over time. The relative date filter is different from other date ranges, because it is constantly updating, instead of showing a fixed date. Now, I have the option of seeing hours from the last week, the last 30 days, this month, etc. I also added filters for milestone status and user. Changing the filter in the dashboard will change all of the tables that are configured with that filter.