Publication Metrics Report
The publication Metrics report shows you a yearly view of your publications. You will see goals and actuals broken up by month. Issues are put into the month bucket based on the reporting date you use.
To access this report, you need the User Permission 'Publication Metrics Report'.
By default, the report will find results using the current year, but this can be changed if needed. You can also use the Publications dropdown to view results for specific publications if desired.
The results are broken into two data tables, and two graphs. For both of the tables, the report breaks up the publications into months. Your issue goals and actuals will show up in the month that corresponds to the issue's reporting date. For instance, if you have a reporting date between 1/1 and 1/31, it will show up in the January column.
Goals:
The goals table pulls data from your Issue Targets and Sales Rep Issue Goals
Circulation: Entered on each issue. The field is under Issue.
# of Pages: The target pages entered on each issue. The field is under Issue Targets.
Ad to Edit: Entered on each issue. The field is under Issue Targets.
Revenue: Entered under Settings > Goals > Sales Goals. The revenue is the total of all reps goals for the issue.
APR: Entered on each issue. This field is under Issue Targets.
Editorial Budget: Entered on each issue. The field is under Issue.

Actuals:
The Actuals data pulls in from your ad sales, editorial setup, and statistics added directly to your issues.
Actual Circulation: The Actual Circulation is entered on each issue. You need to edit the issue and enter the Actual Circulation statistics manually. The system doesn’t keep track of circulation automatically.
Sold Pages: Sold pages is calculated based on the Ad Size of each ad sold into a an issue. The Ad Size is entered when creating your ads. If an ad is not placed, it will still count.
Edit Pages: The editorial pages pulls in from every article you build within an issue. The Edit pages is the total of all articles created. If an article is not placed, it will still count towards your Edit Pages.
Actual Pages: This is the Sum of your Sold Pages and Edit Pages.
Ad to Edit %: Your Sold Pages divided by your Edit Pages
Revenue: All ads that are confirmed sales. Sales that are 100%.
% Revenue Goal: Your actual revenue divided by your revenue goal.
APR: The Revenue of the issue divided by the Sold Pages.
% APR Goal: You actual APR divided by your APR goal.
Writer Budget: The actual budget amounts specified for writers on editorials.
Photographer Budget: The actual budget amounts specified for photographers on editorials.
Cash to Goal:
Underneath the data tables are two visual charts that represent the data in a different format. The first is Cash to Goal. In this graph, you will see two bars for each month of the year. One bar represents the total Sales Goals, and one represents the total Sales made. This visual representation allows you to easily compare the goal vs. sales amounts for each month of the year.
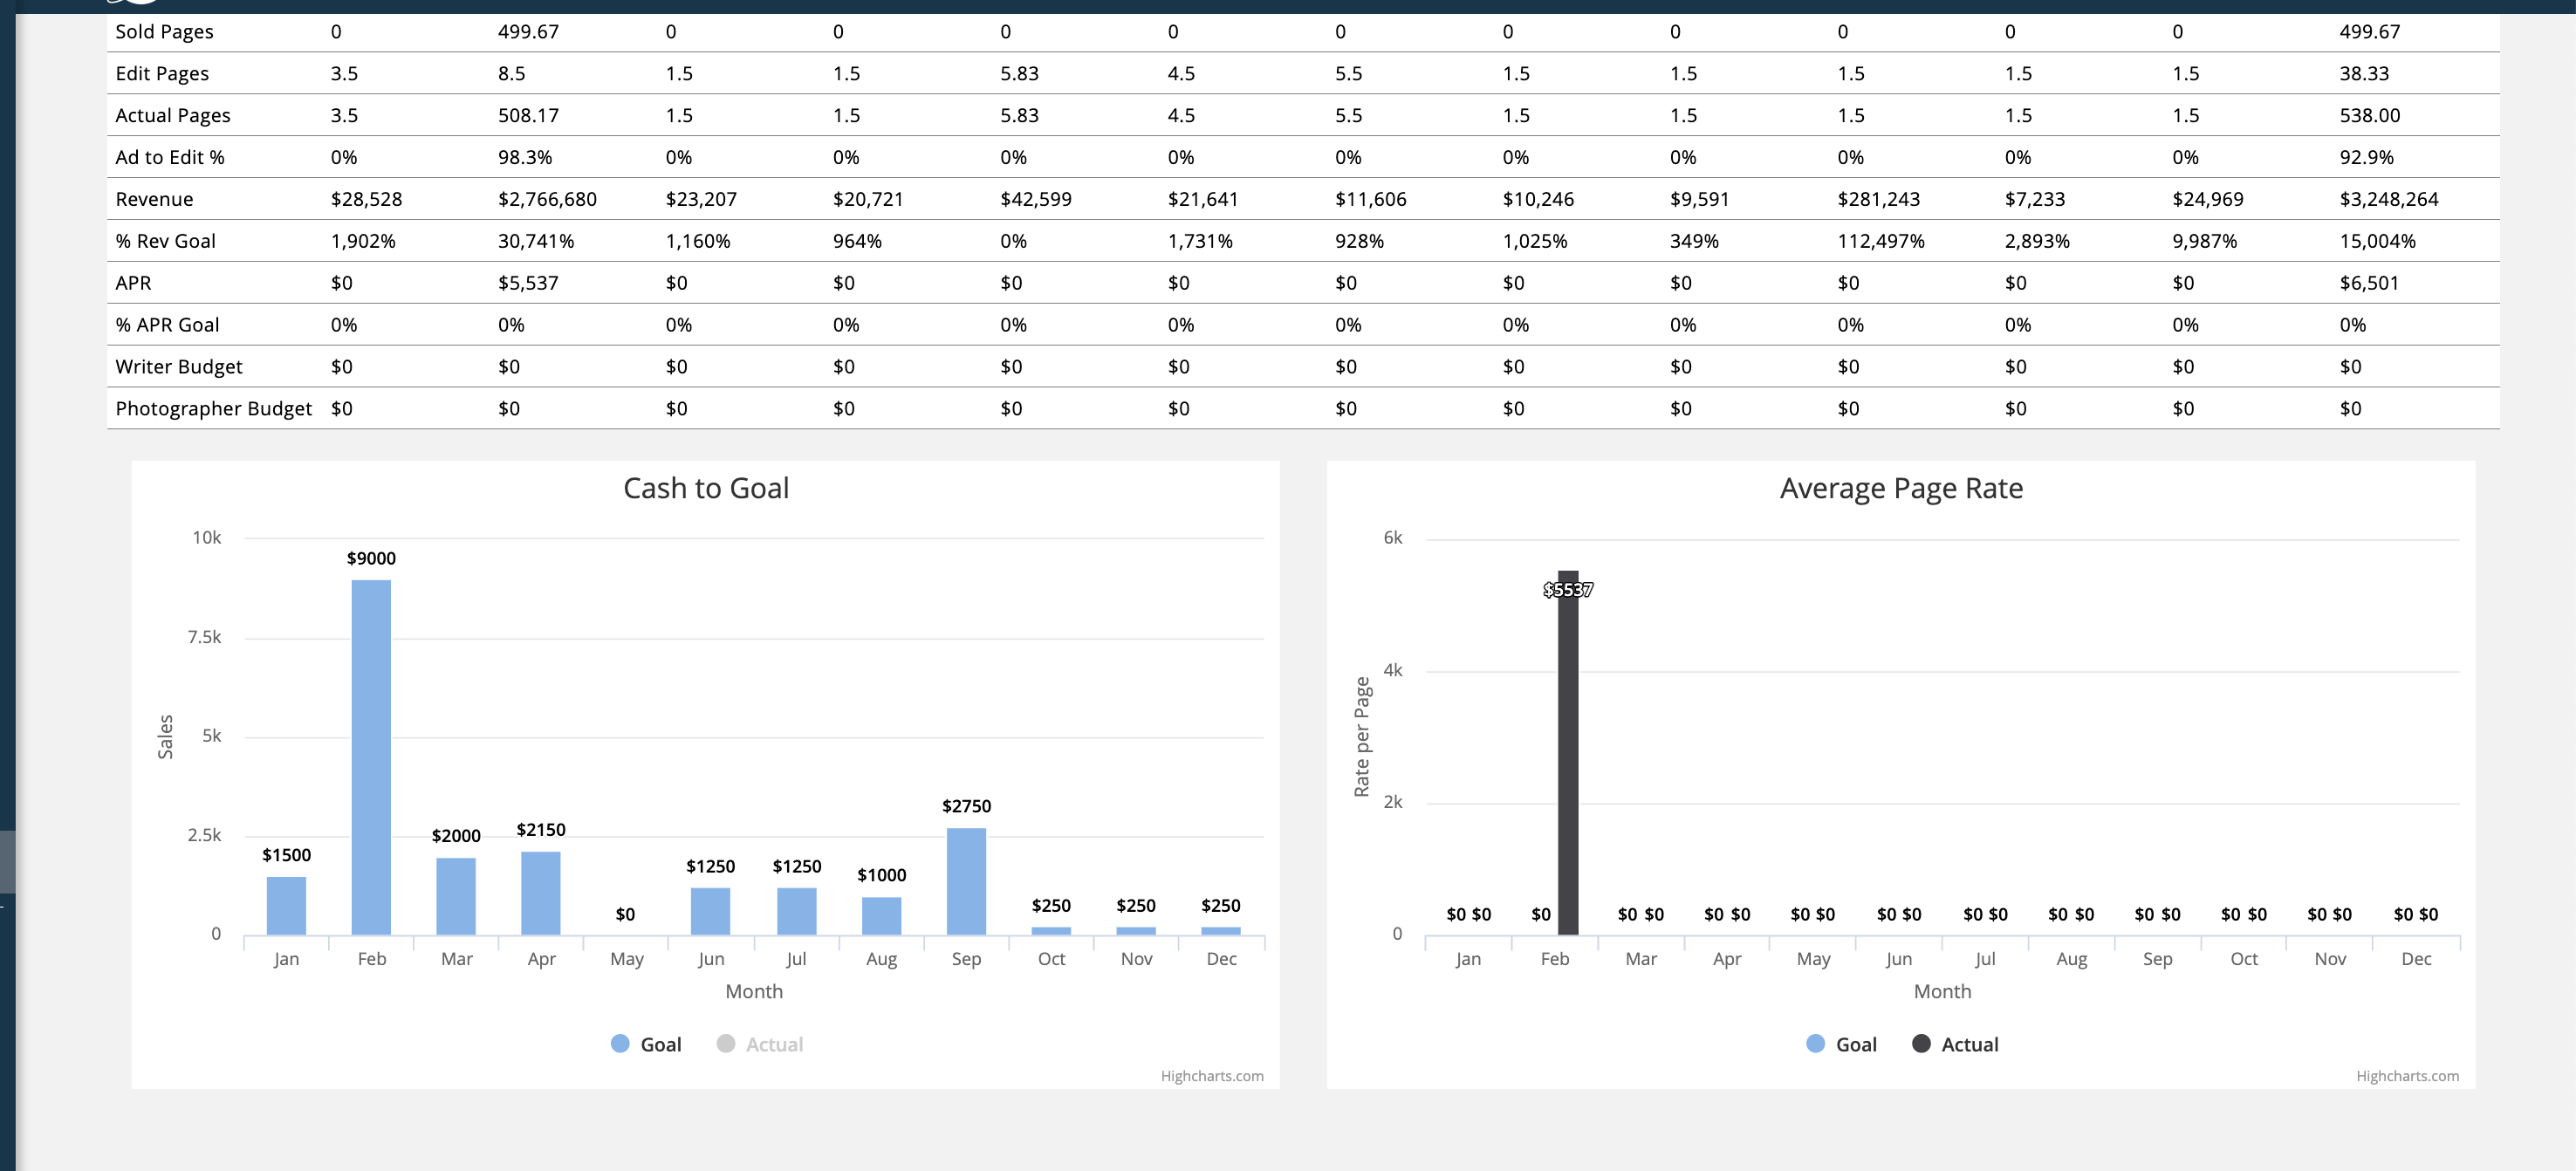
Average Page Rate:
The second graph is another bar chart which breaks down the goal for your page rates compared to the actual amounts your pages were sold for, per month. In each month, you'll see one bar for the goal, and one bar for the actual rate, making it easy to compare how you are tracking toward your goals.
Updated 3/27/2025