Scorecard Dashboard
Track weekly business metrics, set performance targets, and monitor your organization's key indicators over time — all from a single, centralized view.
Before your team can begin logging data, an administrator must configure the metrics that will appear on the Scorecard. This is done in the Users & Org Setup area.
Navigate to Scorecard Setup: Go to Settings > Reports > Scorecard Elements. You need the User Permission 'Scorecard Elements' to access this page.
Add a New Metric: Click Add Scorecard Element to create a new scorecard entry. Each metric you create will appear as a row on the Scorecard Dashboard.
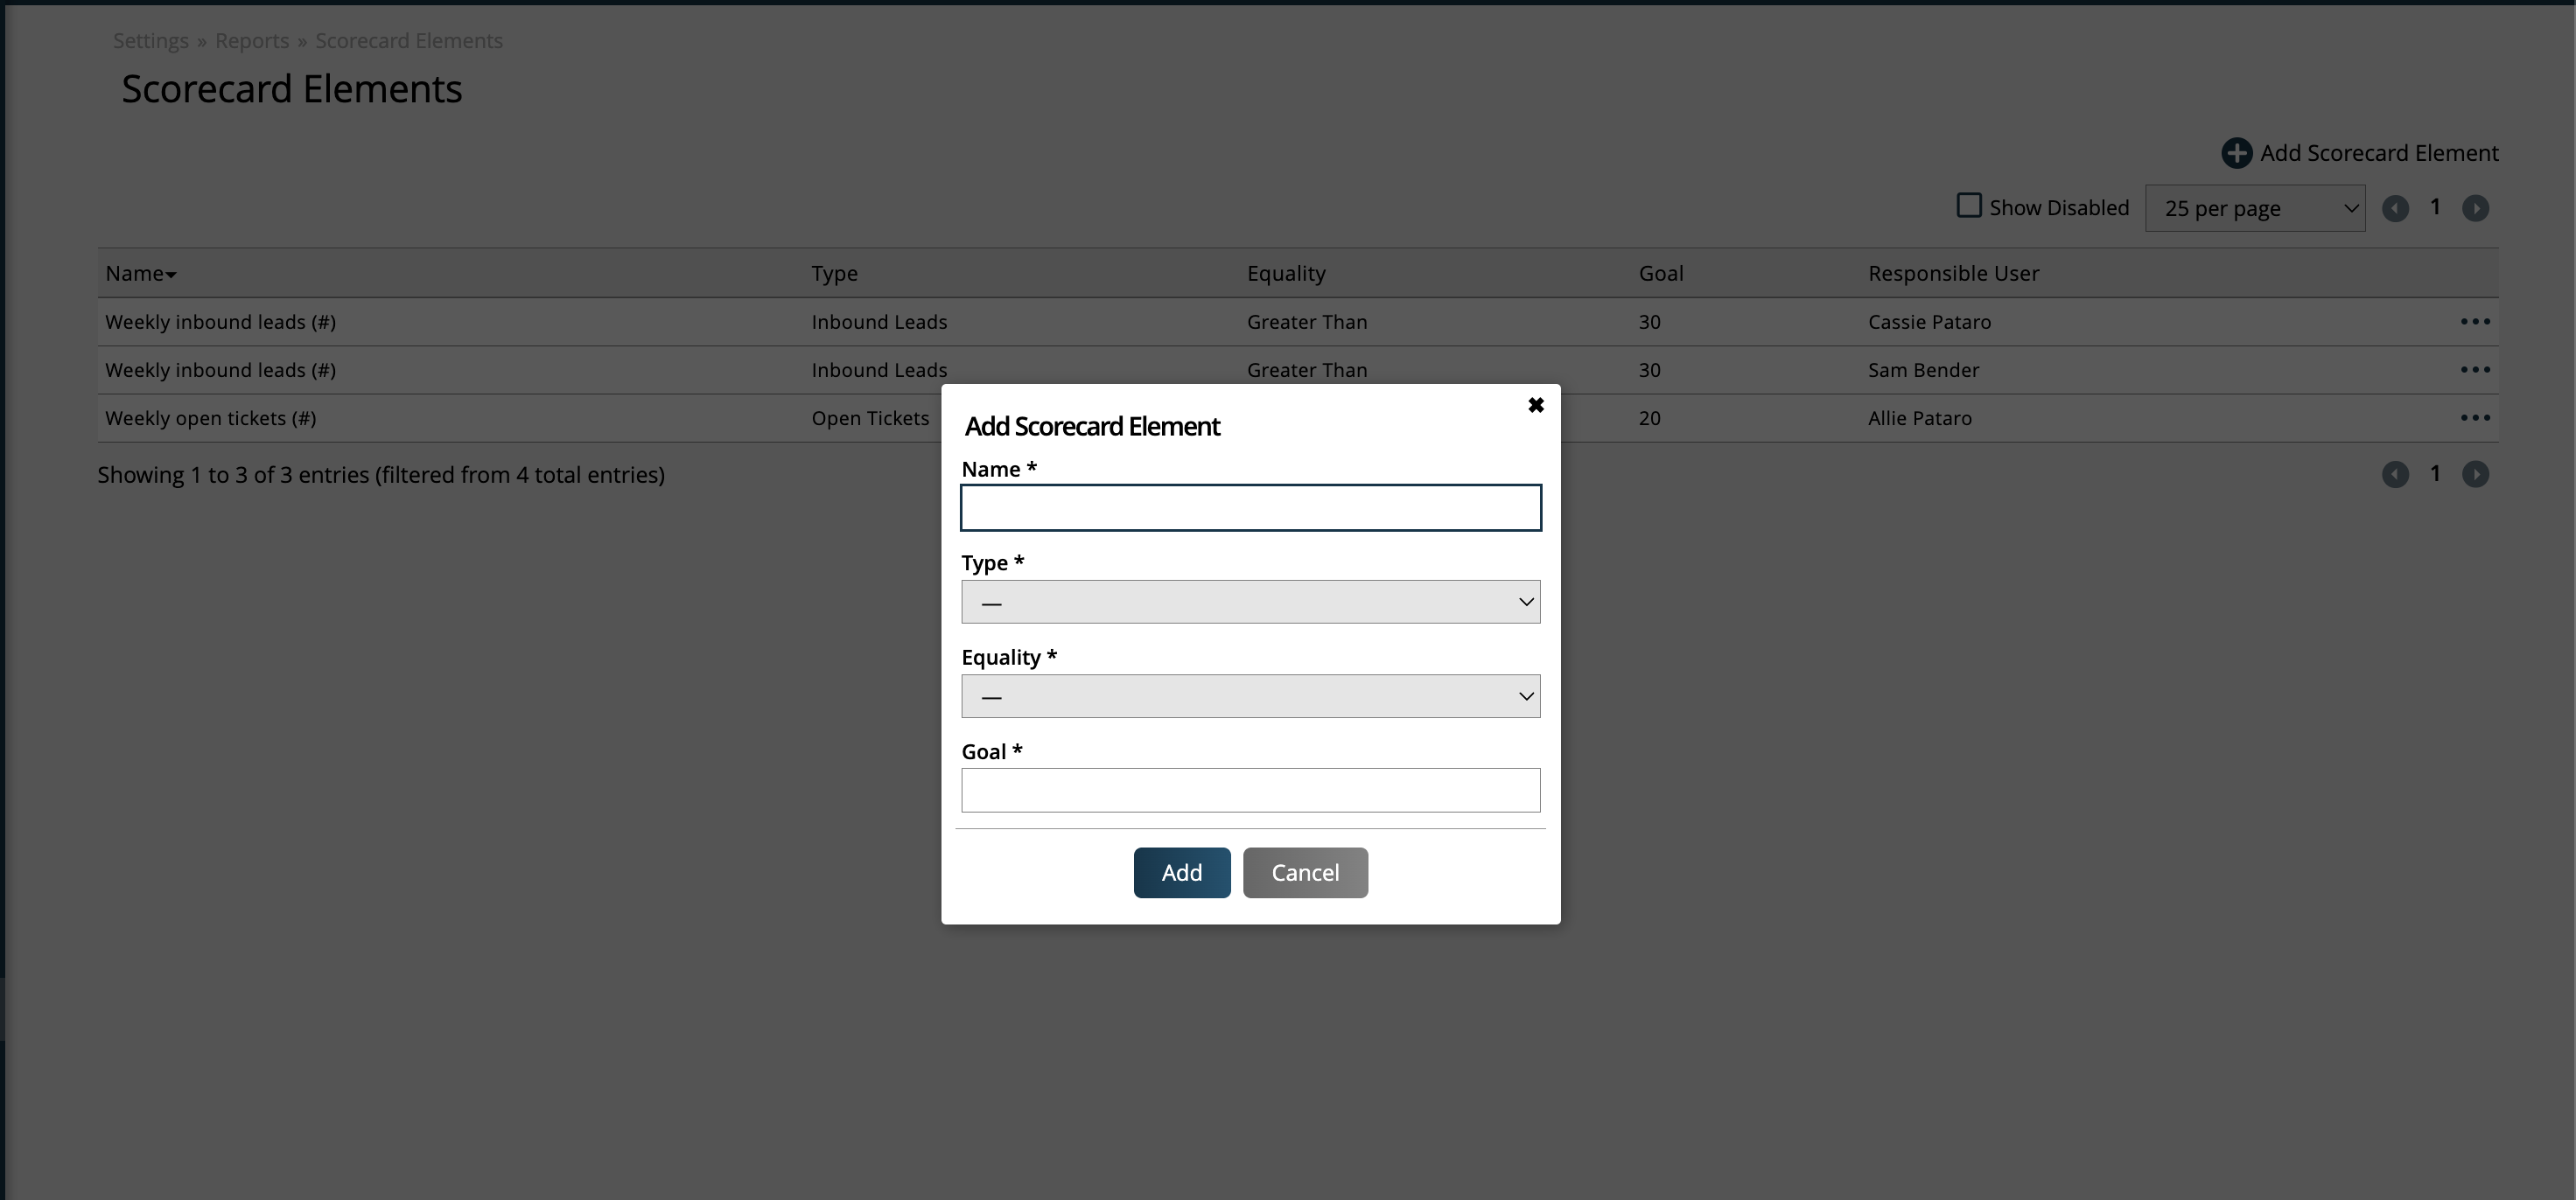
Define the Metric Fields: Complete the required fields for the metric.
Metric Name: A clear, descriptive label for the metric — for example, Inbound Leads Generated or Open Support Tickets. This name will appear on the dashboard and in data entry views.
Metric Type: Defines how the metric value is sourced, such as # of Orders (4-week trailing avg), Inbound Leads, or Closed Tickets. At this time, all metric types require manual data entry.
Tip
For metrics where a specific type doesn't match your use case, select the Manually Entered Data type as a flexible catch-all. This type places no restrictions or expectations on the format of the value you enter.
Assigned User: The team member responsible for logging this metric's weekly value. Only the assigned user (and administrators) can enter data for this metric.
Goal Value: The numeric target for this metric — for example, 50 for 50 leads per week, or 10000 for $10,000 in sales.
Goal Equality: How the entered value is compared to the goal. Options are: > (greater than), < (less than), or = (equal to). For example, a leads metric might use > to indicate the value should exceed the goal.
Tip
Naming your metrics clearly pays off. Since all metrics appear together on the dashboard, using consistent and descriptive names from the start makes the Scorecard much easier to read at a glance. Consider including the unit in the name — for example, New Orders (#) or Revenue Booked ($).
Save and Repeat: Save the metric and repeat the process for any additional metrics your organization wants to track. There is no limit to the number of metrics you can configure.
Once metrics are configured, assigned users log their values on a weekly basis through the Scorecard Dashboard. Each entry is tied to a specific week, keeping the data organized and comparable over time.
Open the Scorecard Dashboard: Navigate to Home > Scorecard Dashboard. You need the User Permission 'Scorecard Dashboard' to access this page.
Update Scorecard Entries: Click the Update Scorecard Entries button to update your entries for the week. Here, the Responsible User will default to yourself, but if you have the sub-permission to 'Edit All User Scorecard Entries', then you can view and edit all users' metrics, not just your own.
Select the Entry Date: Choose the date for the weekly entry. Entries are anchored to the Sunday of each week, so the date picker will constrain your selection to Sundays. This ensures consistent weekly alignment across all metrics.
Enter the Value for Each Metric: For each metric assigned to you, enter the numeric value for that week. Enter the actual observed figure — not a running total — unless the metric is specifically designed to track cumulative values.
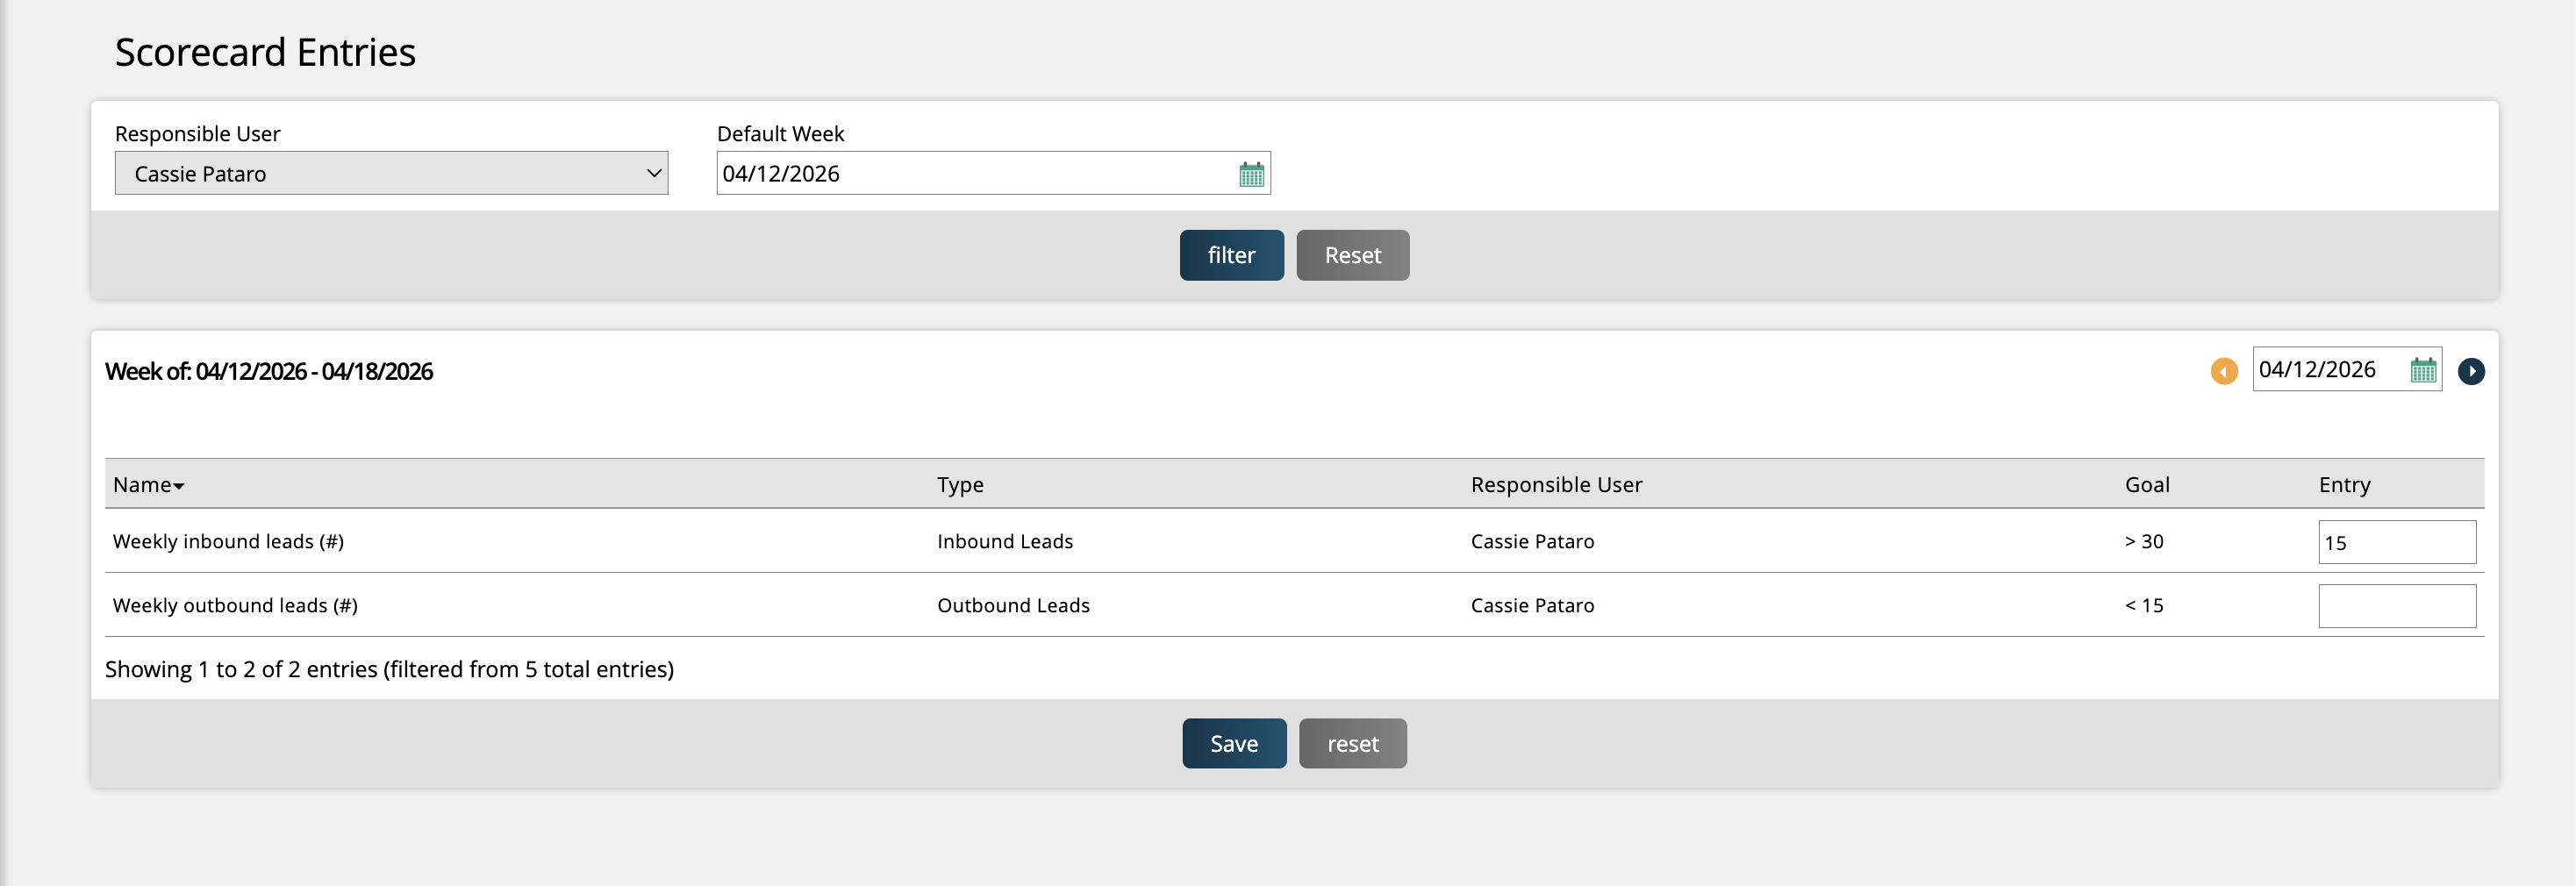
Save Your Entries: Save the data once all values for that week have been entered. The values will be stored and will immediately appear in the dashboard's historical table view.
Note
Entries are tied to a specific week. If you need to correct a past entry, navigate back to that week's date and update the value. Submitting a new entry for the same week will overwrite the previous one.
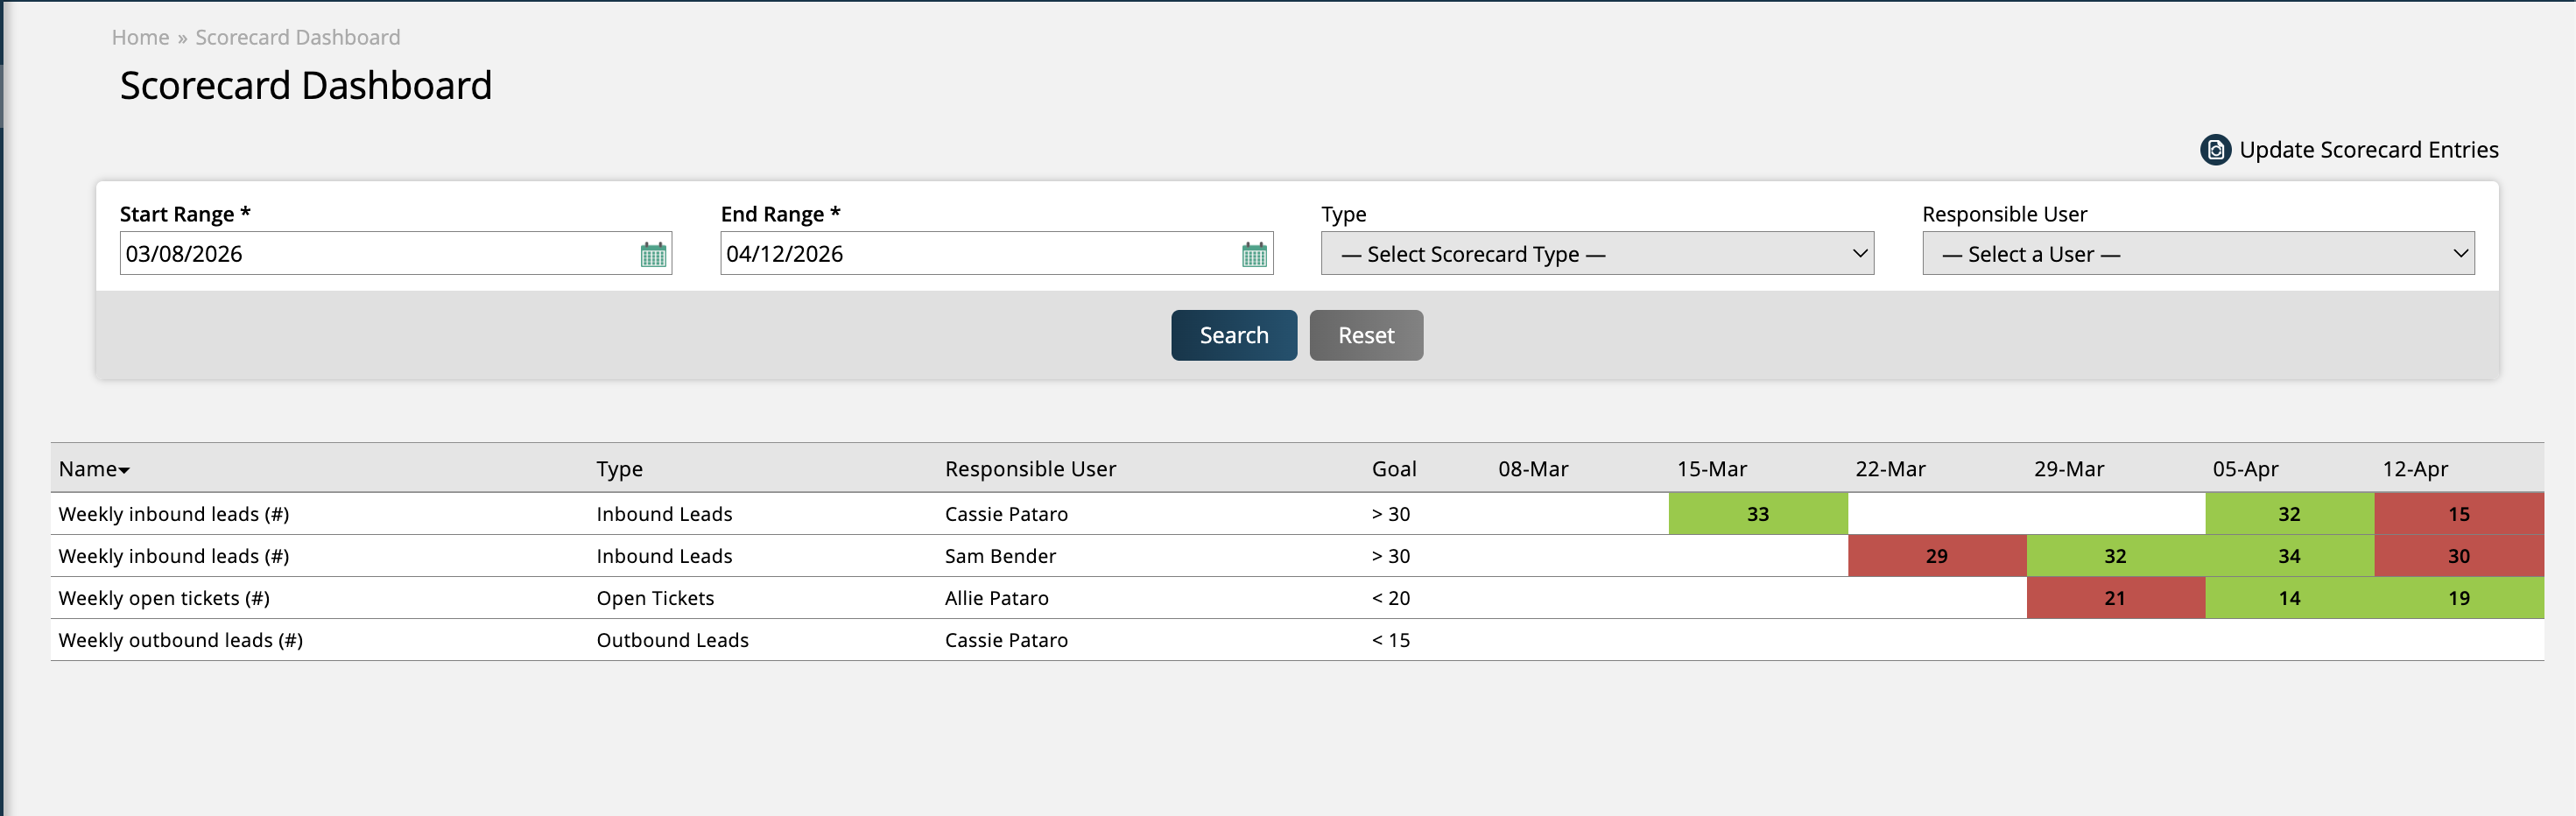
The Scorecard Dashboard displays your historical metric data in a columnar table format, with each column representing a week and each row representing a metric. This layout makes it easy to spot trends, identify gaps, and compare performance across time periods.
Set Your Date Range: Use the date range selector on the dashboard to define the time window you want to review. The table will display one column per week within that range, ordered chronologically.
Review the Table: Each row corresponds to a configured Scorecard metric. The cells display the value entered for that metric in that week. Weeks with no entry will appear blank or with a dash.
Evaluate Against Goals: Values are visually compared against each metric's configured goal and equality operator. This allows you to quickly identify which metrics are on-target and which need attention. Cells are highlighted in green that met the goal, whereas cells that did not meet the goal are highlighted in red.
Tip
For the best visibility into trends, select a date range of at least 4–8 weeks. This gives you enough data points to distinguish a one-time anomaly from a developing pattern.
Note
Users with administrator access can view and edit Scorecard data for all assigned users. Standard users will see only the metrics assigned to them, plus any that their role grants viewing access to.
New 4/16/2026